Tally chartsSingle-unit scale
Read each tally chart and answer the question.
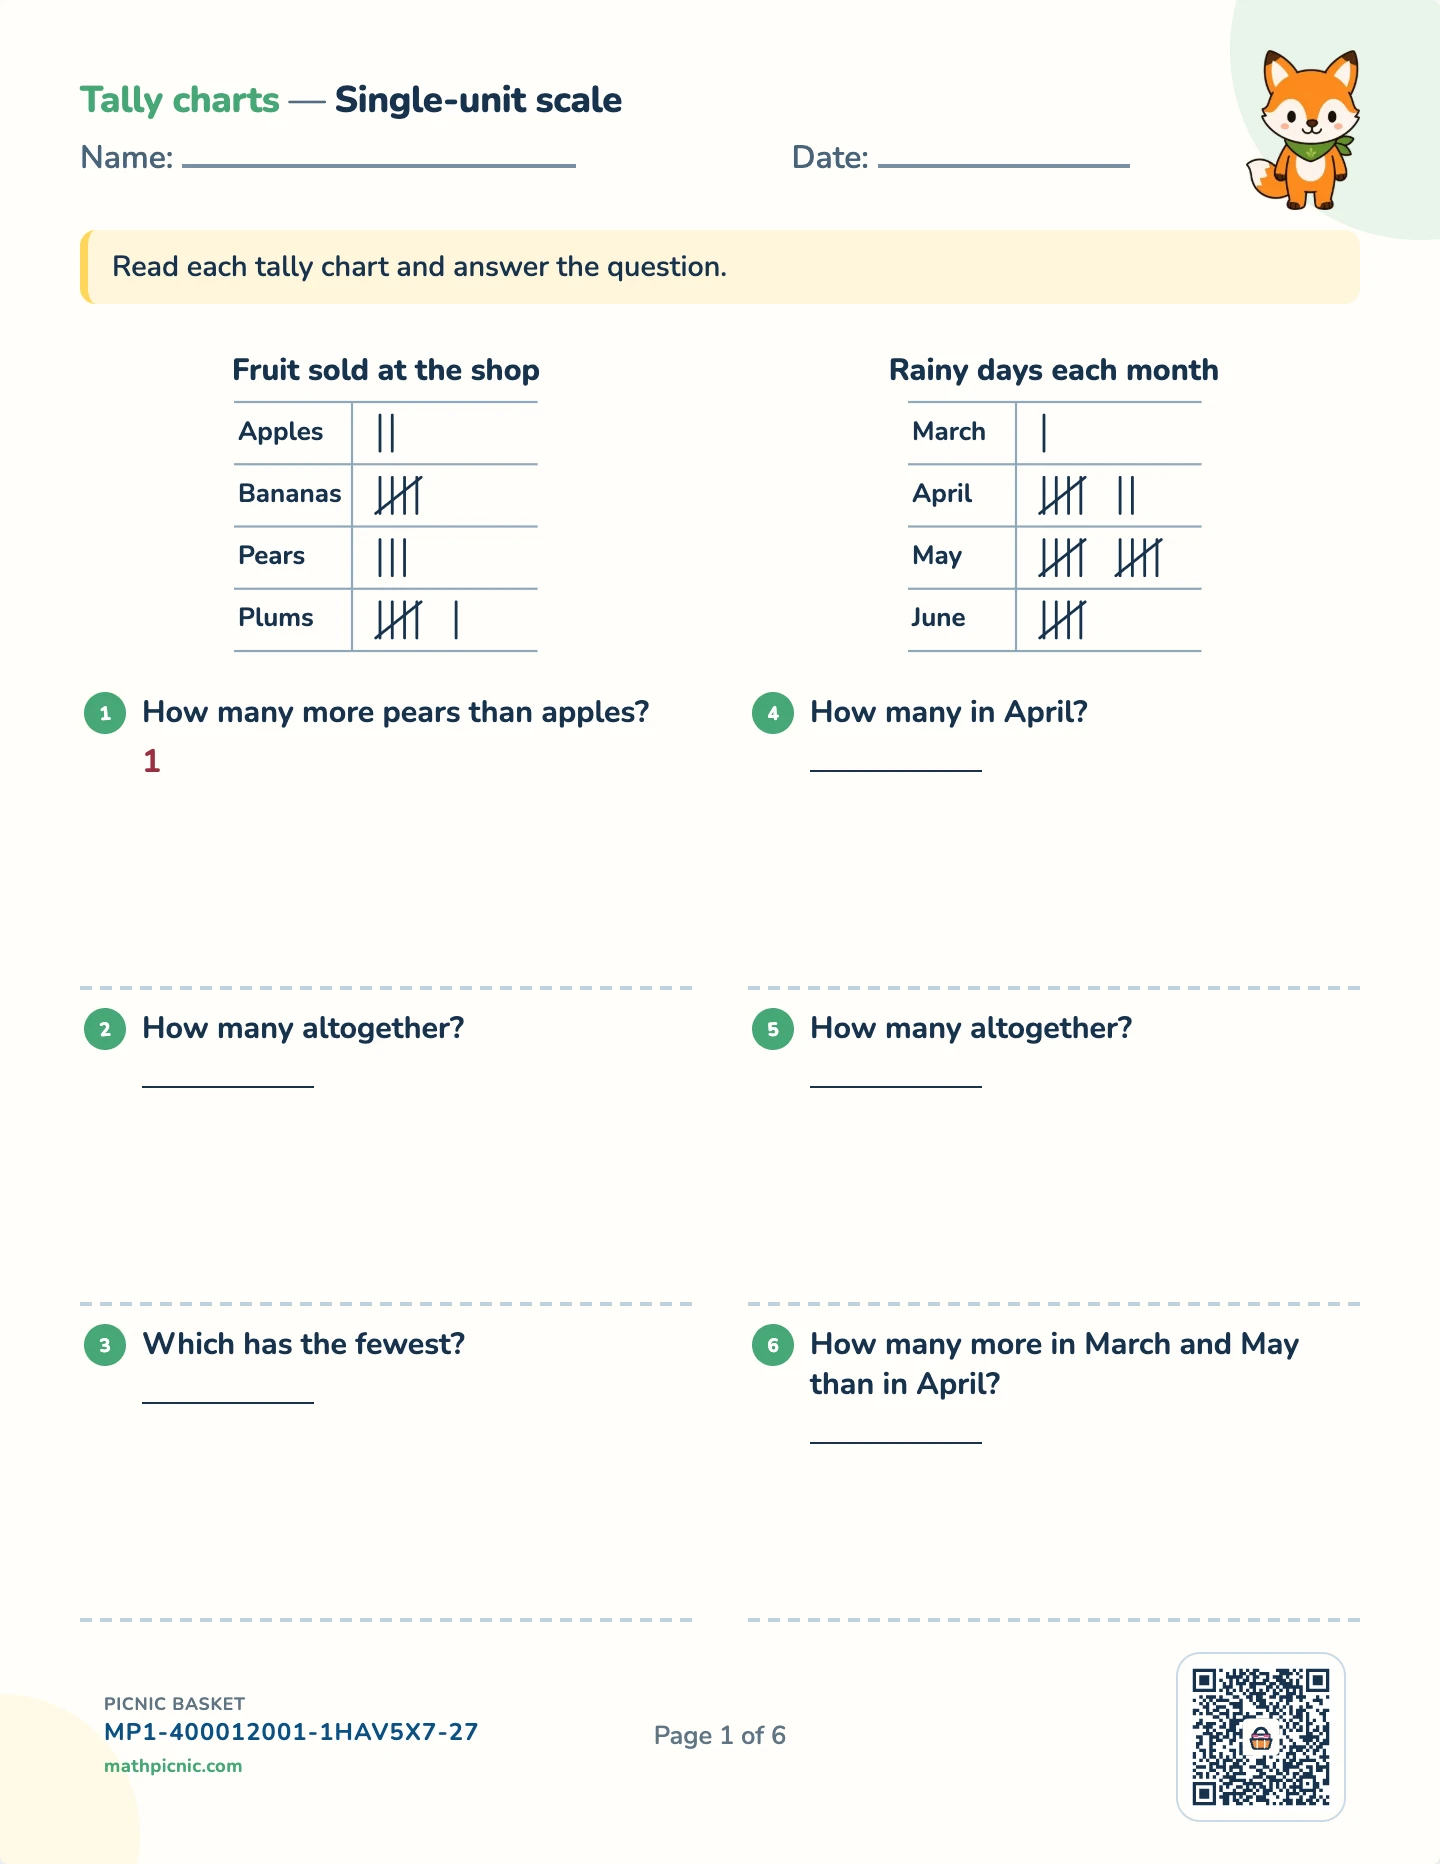
How many more pears than apples?
How many altogether?
Which has the fewest?
How many in April?
How many altogether?
How many more in March and May than in April?
Tally charts, picture graphs, bar graphs, line plots and circle graphs — every graph a primary class is asked to read.
5 sheets · 30 questions · one answer key · 6 pages
Recommended for grades 1–4
Tally chartsSingle-unit scale

Read each tally chart and answer the question.
How many more pears than apples?
How many altogether?
Which has the fewest?
How many in April?
How many altogether?
How many more in March and May than in April?
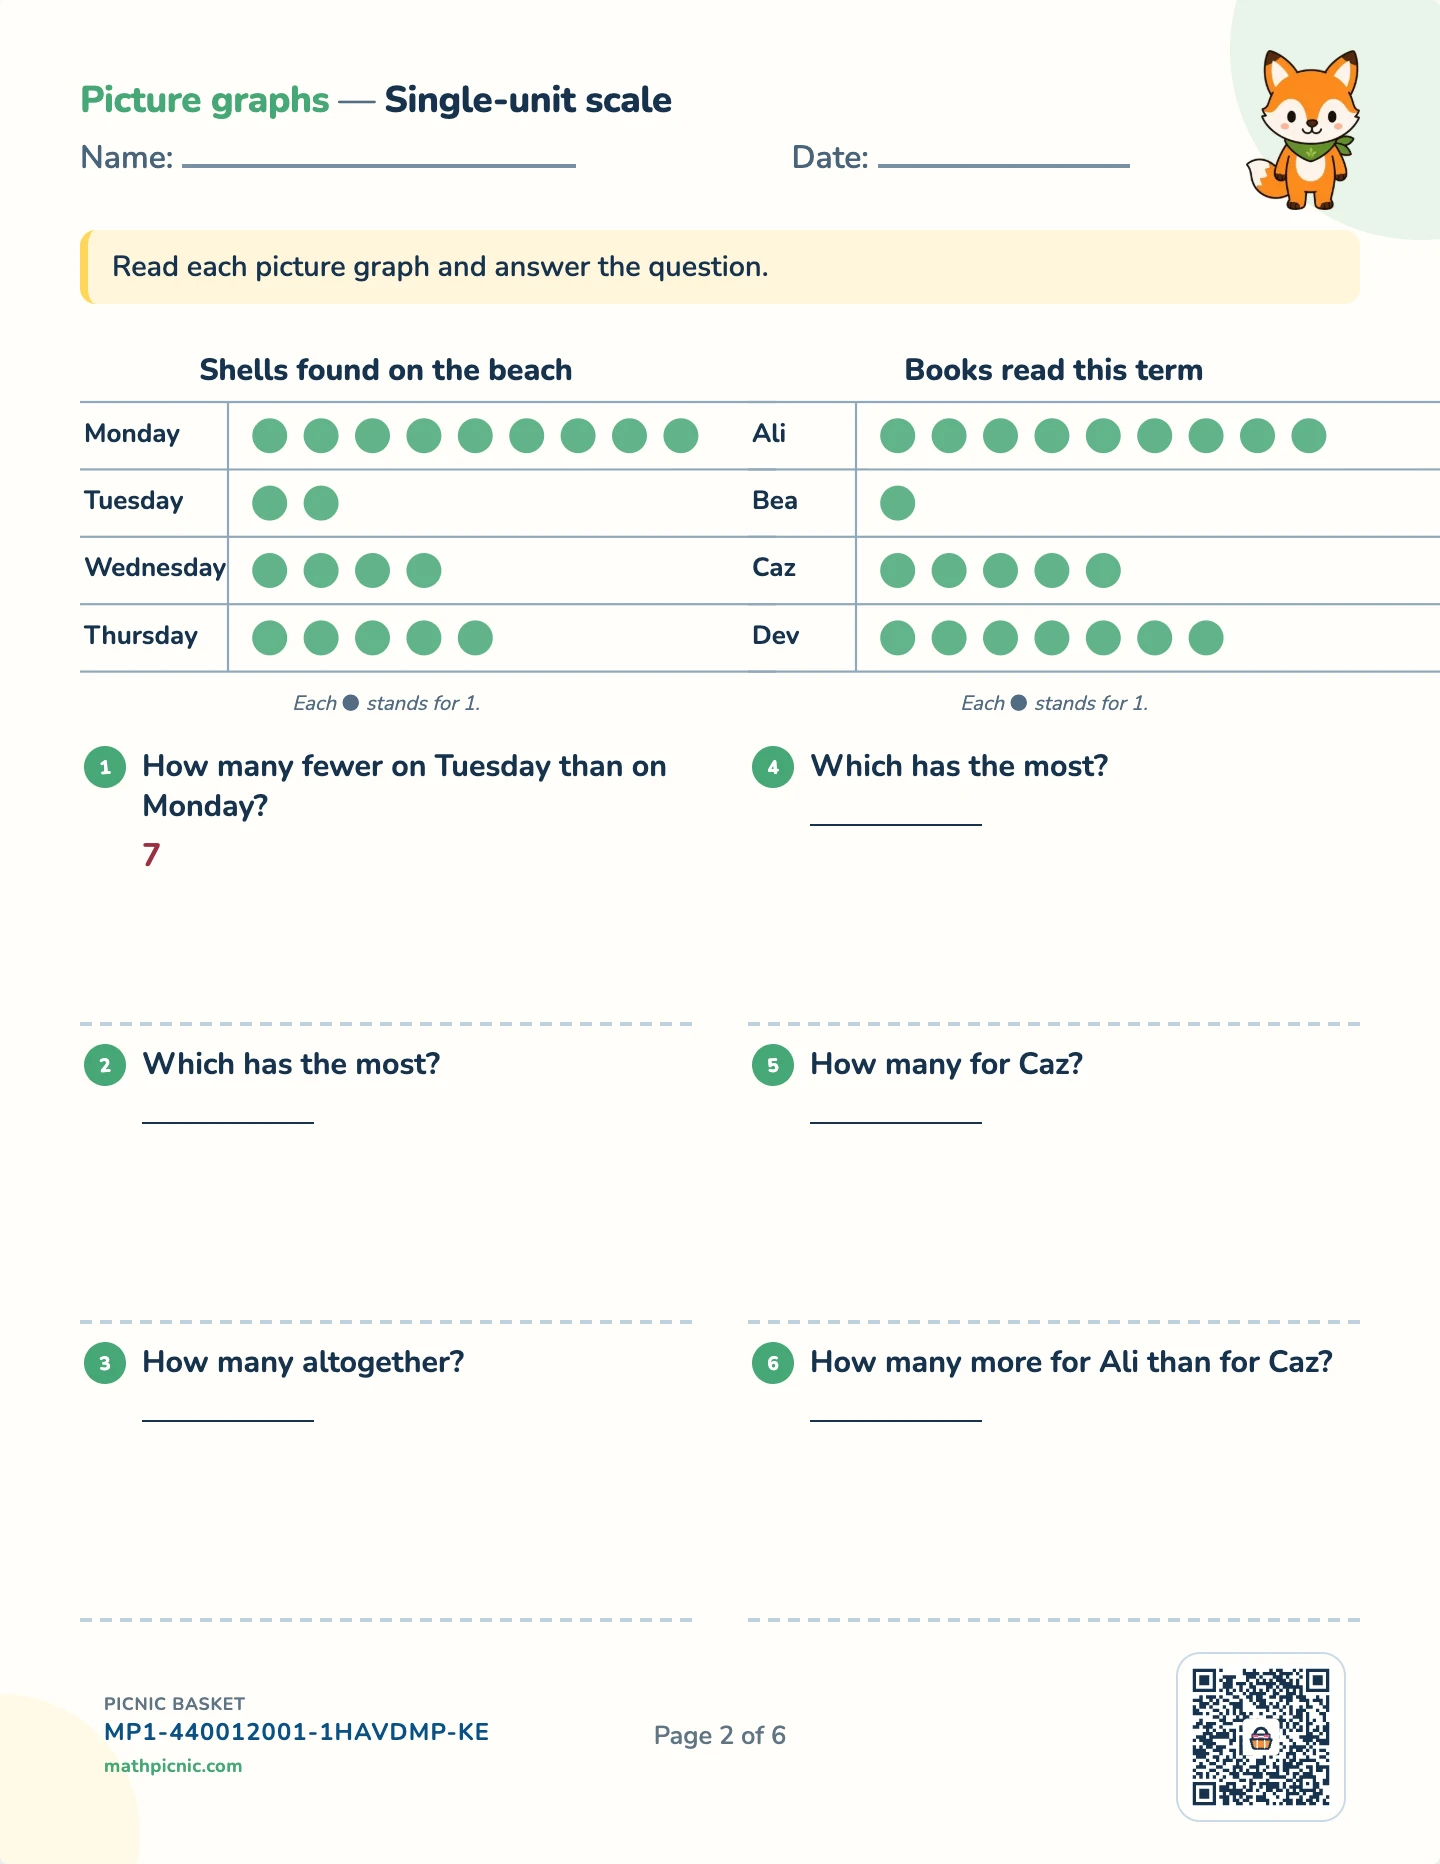
Picture graphsSingle-unit scale

Read each picture graph and answer the question.
Each ● stands for 1.
How many fewer on Tuesday than on Monday?
Which has the most?
How many altogether?
Each ● stands for 1.
Which has the most?
How many for Caz?
How many more for Ali than for Caz?
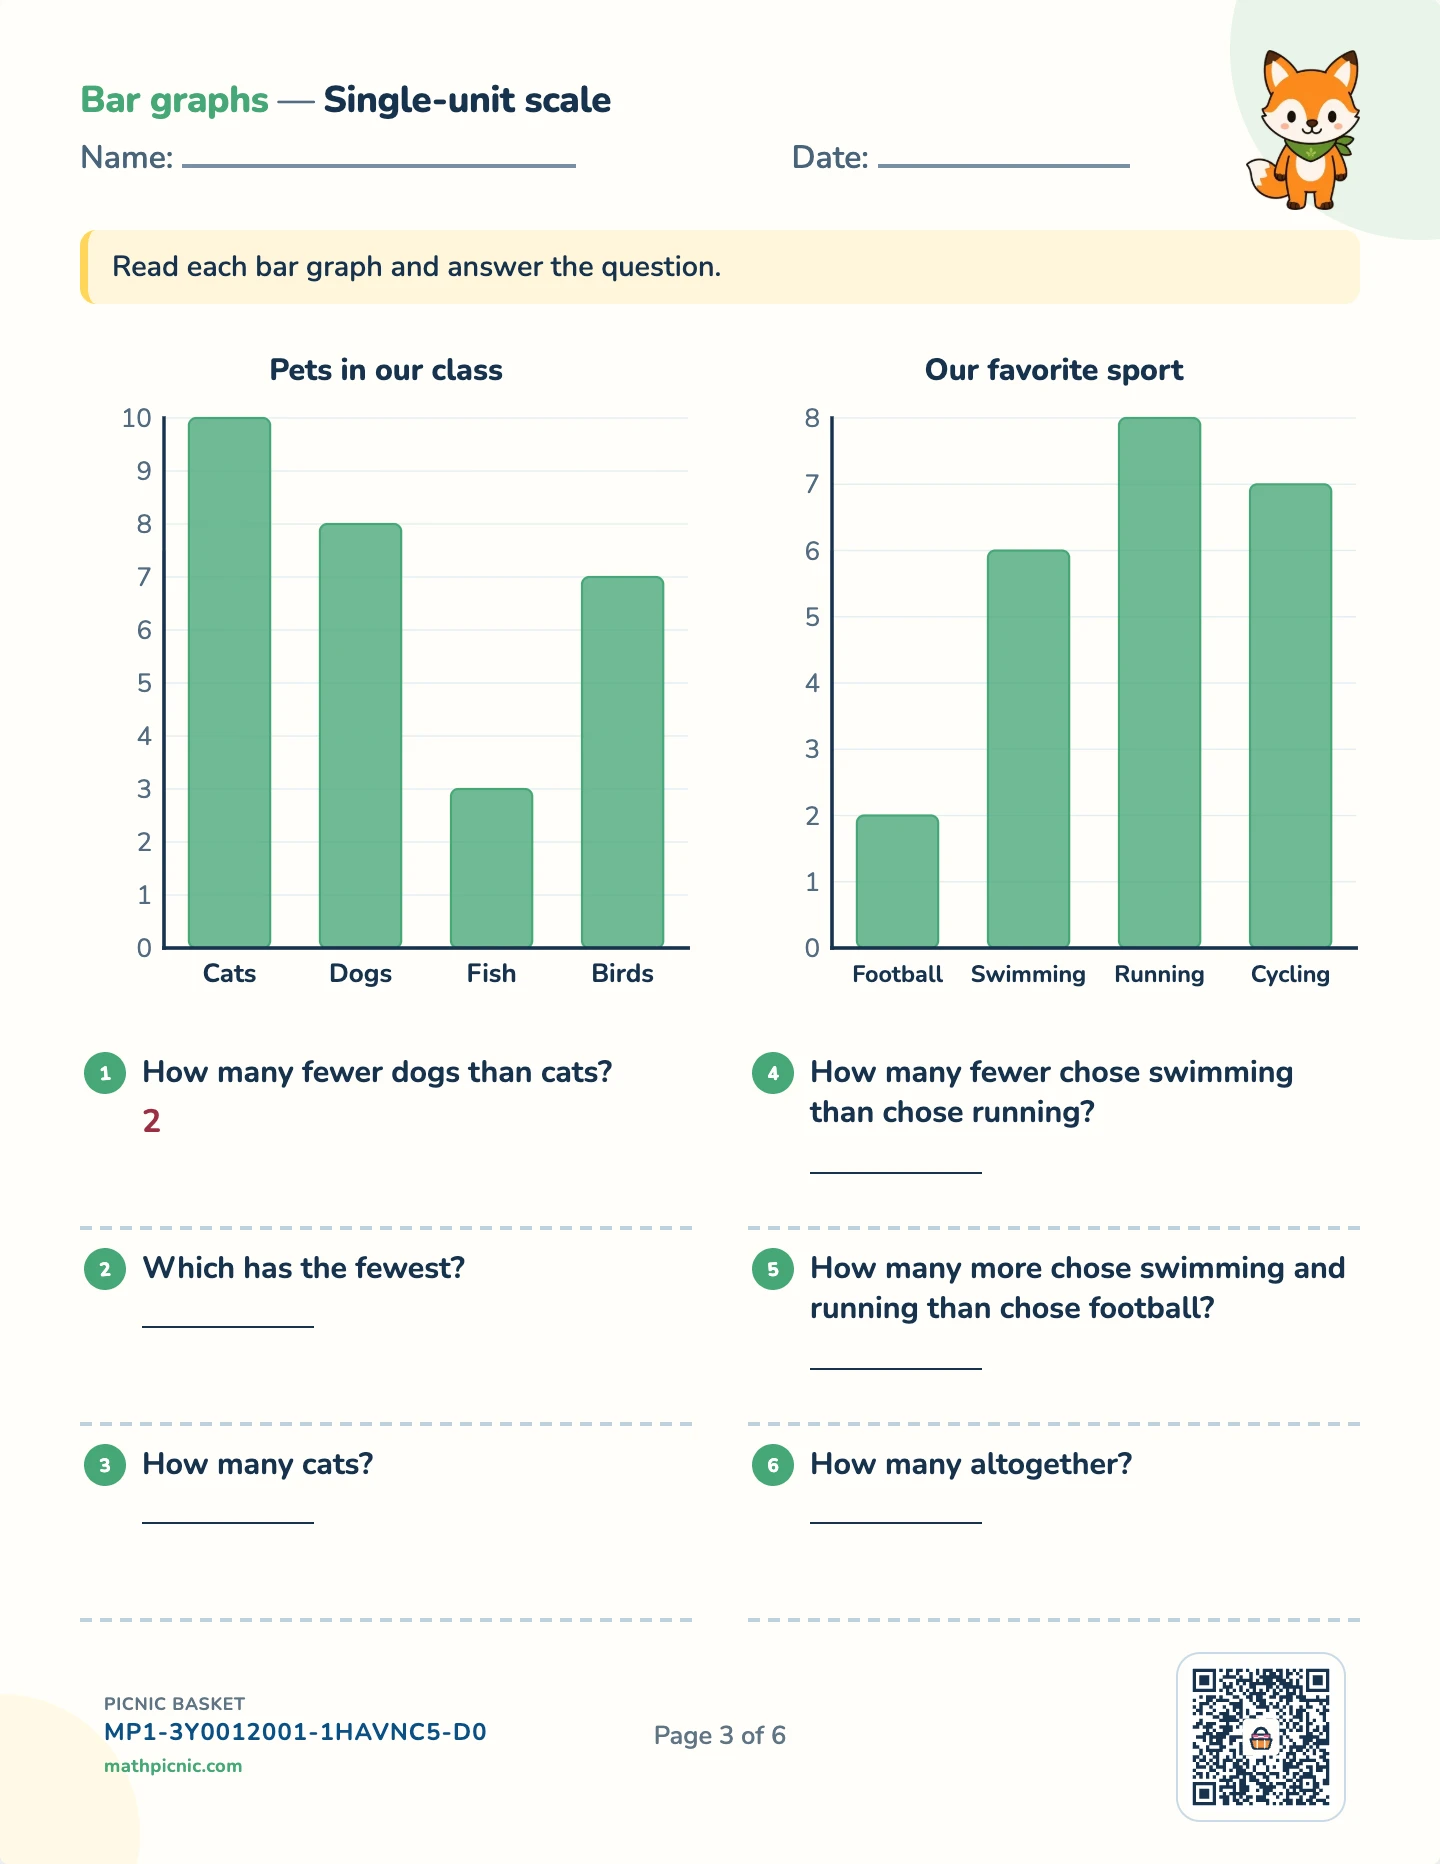
Bar graphsSingle-unit scale

Read each bar graph and answer the question.
How many fewer dogs than cats?
Which has the fewest?
How many cats?
How many fewer chose swimming than chose running?
How many more chose swimming and running than chose football?
How many altogether?
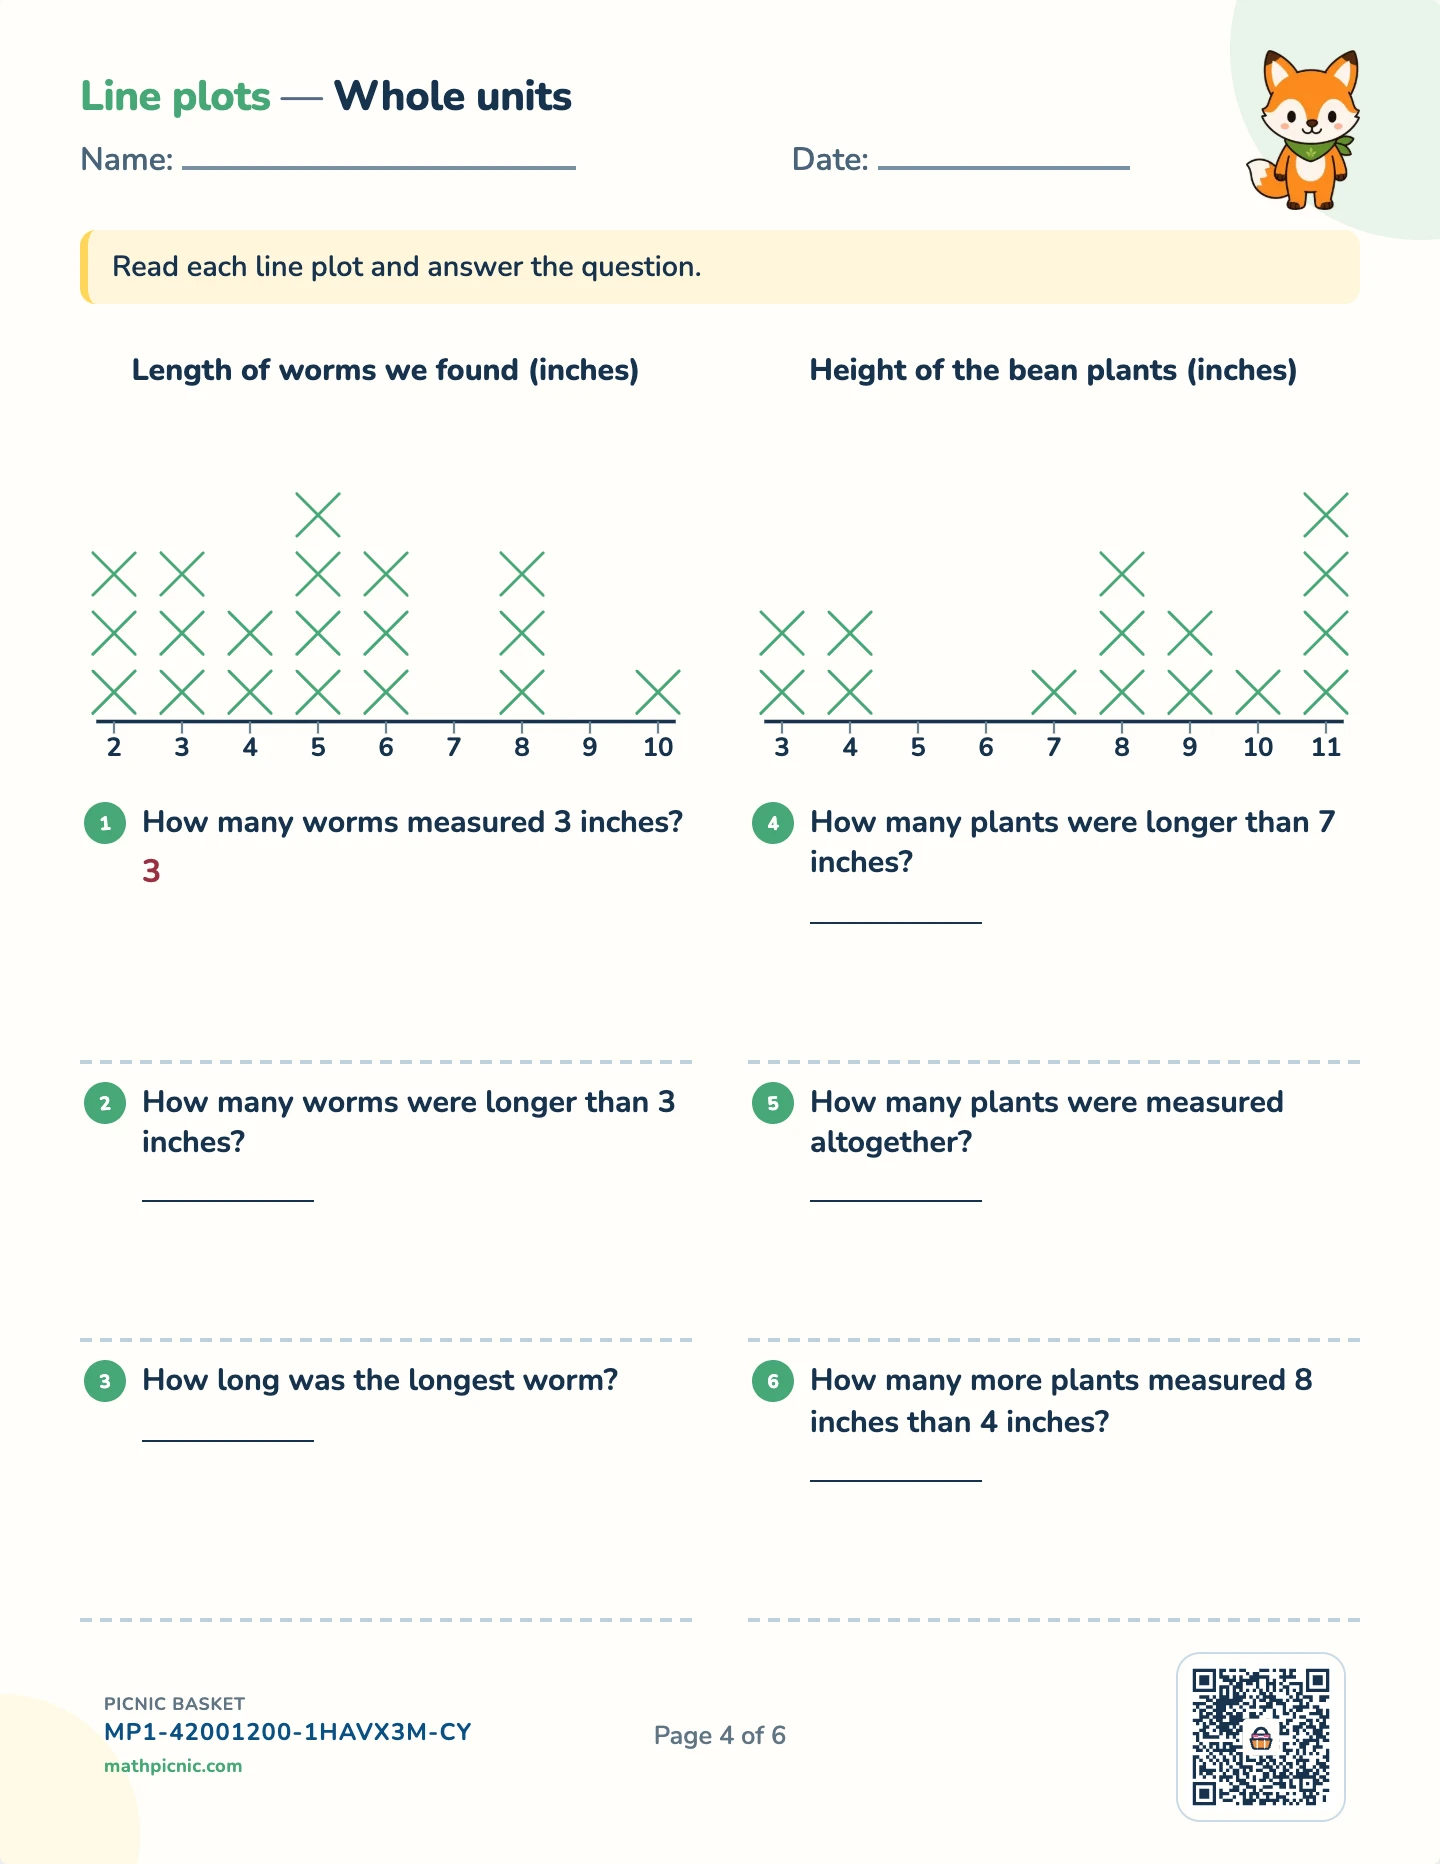
Line plotsWhole units

Read each line plot and answer the question.
How many worms measured 3 inches?
How many worms were longer than 3 inches?
How long was the longest worm?
How many plants were longer than 7 inches?
How many plants were measured altogether?
How many more plants measured 8 inches than 4 inches?
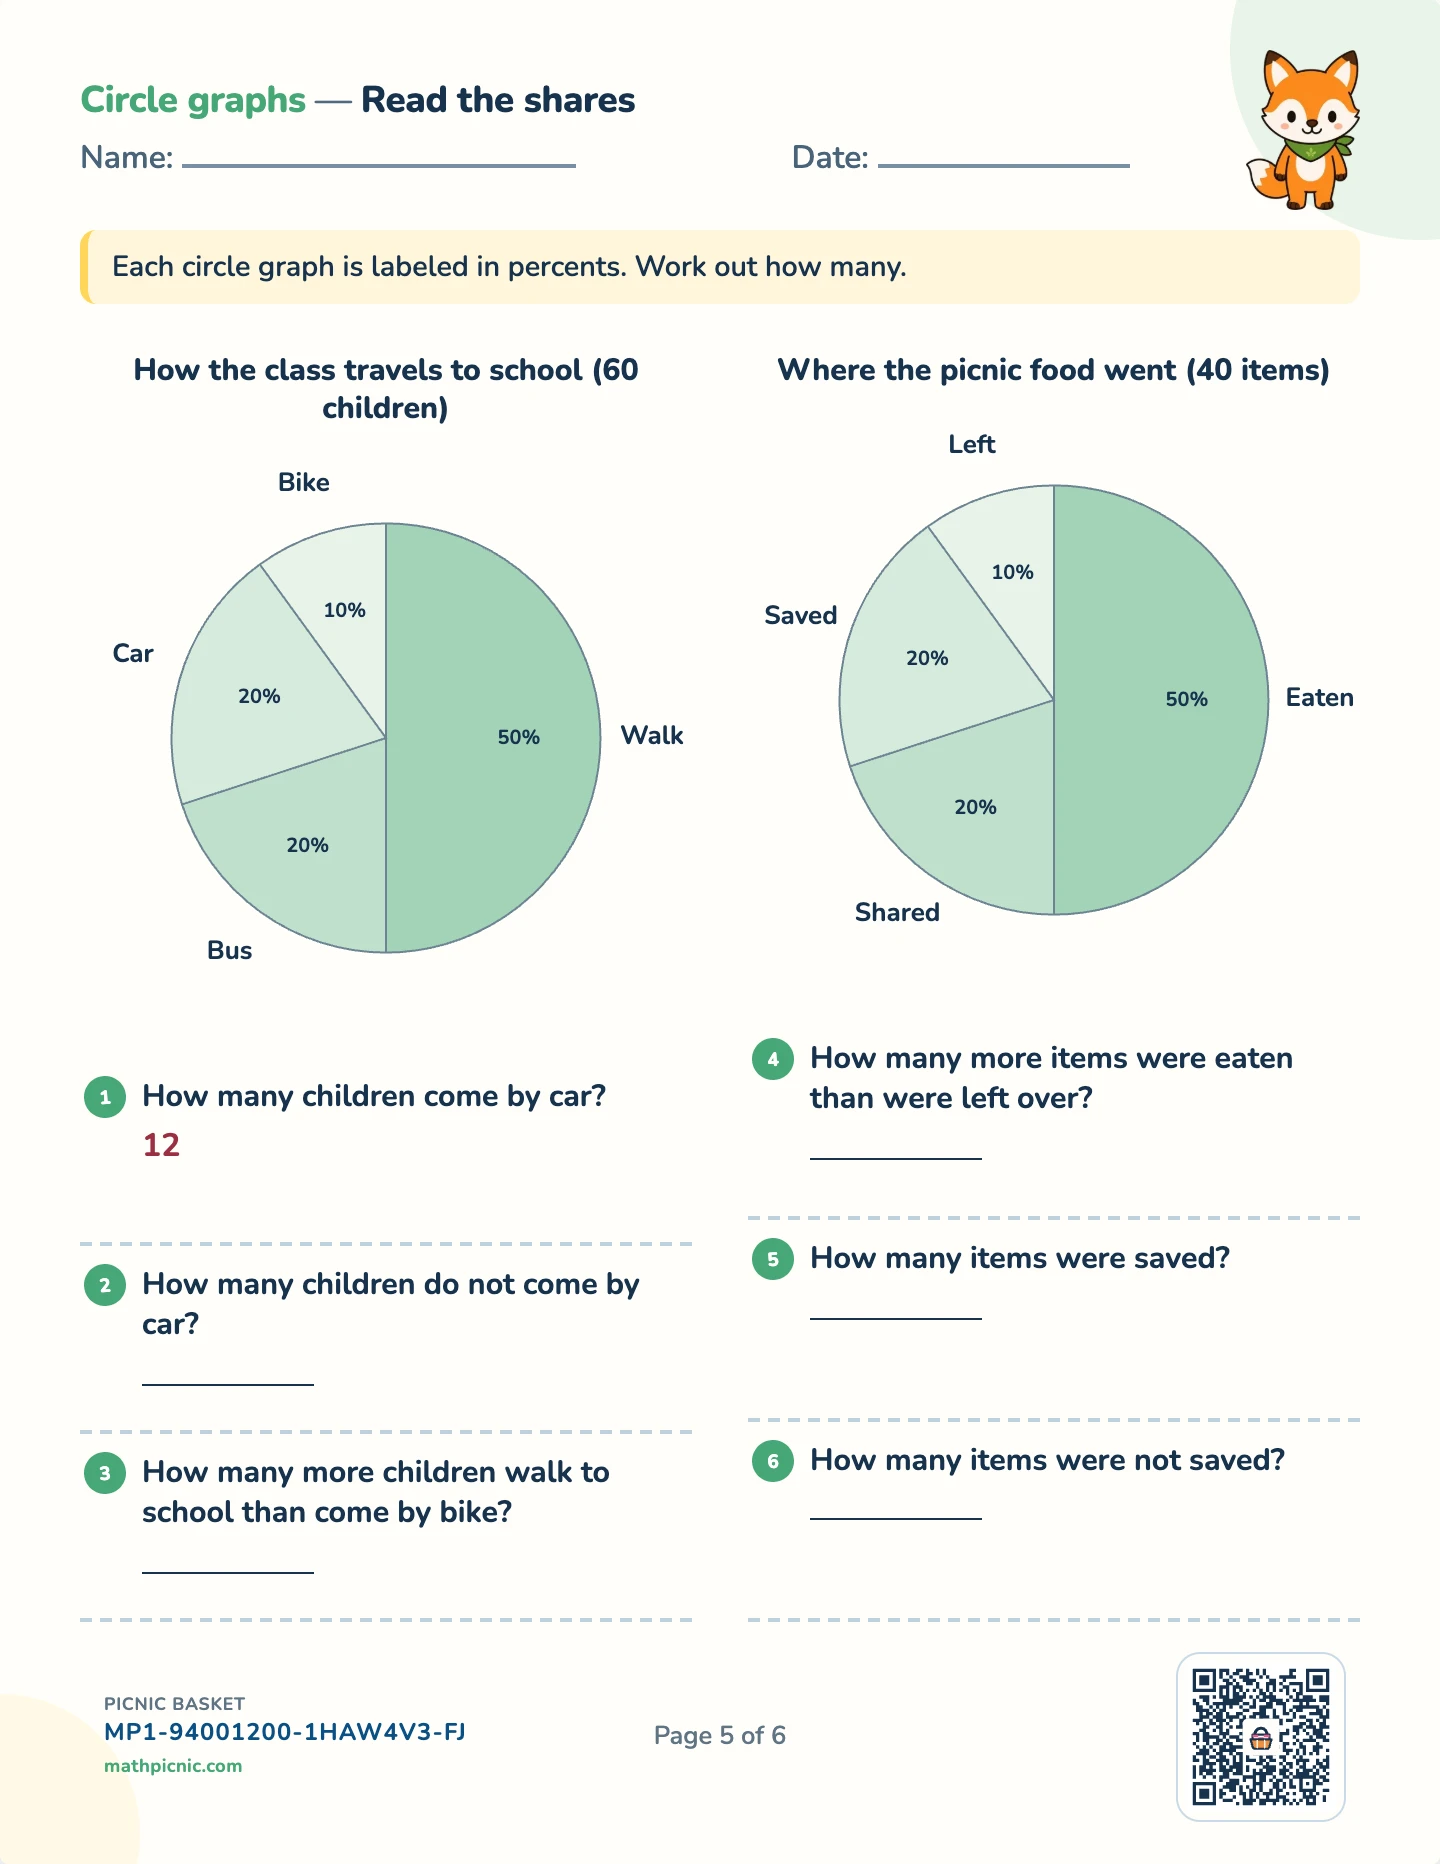
Circle graphsRead the shares

Each circle graph is labeled in percents. Work out how many.
How many children come by car?
How many children do not come by car?
How many more children walk to school than come by bike?
How many more items were eaten than were left over?
How many items were saved?
How many items were not saved?
Power Pack · Reading graphsAnswer key