
Graph and data worksheets
Not sure what comes next? Start with the first sheet that feels comfortable.
Or you can pick your level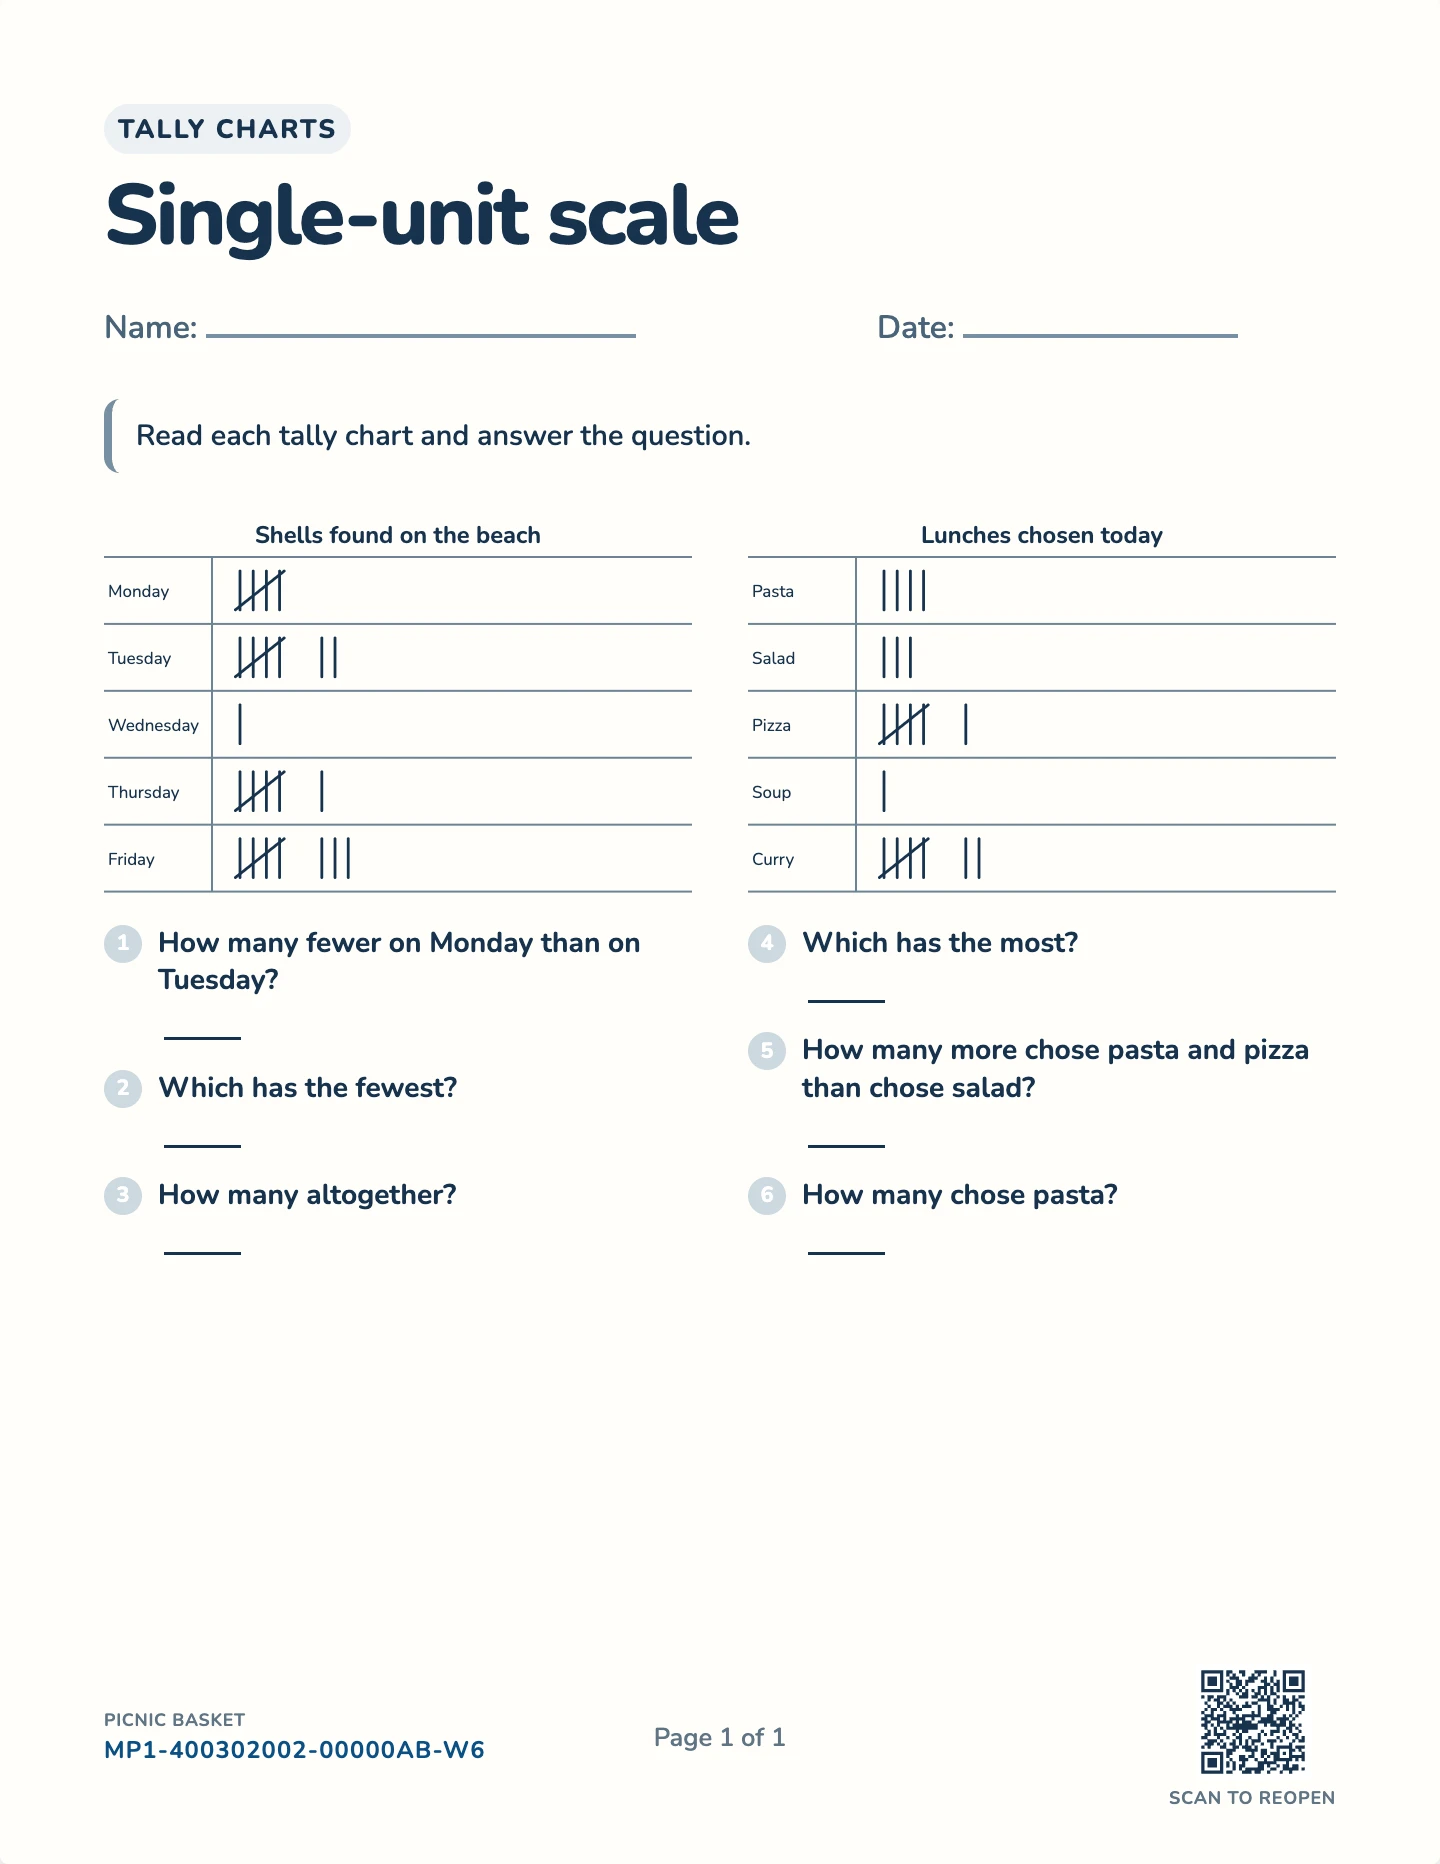
Nothing matches that. Try a skill, a number, or a grade.
In teaching order
Graphs and data worksheets, easiest first
Each sheet assumes the one above it is comfortable. Start where your child is, not at the top.- Tally charts
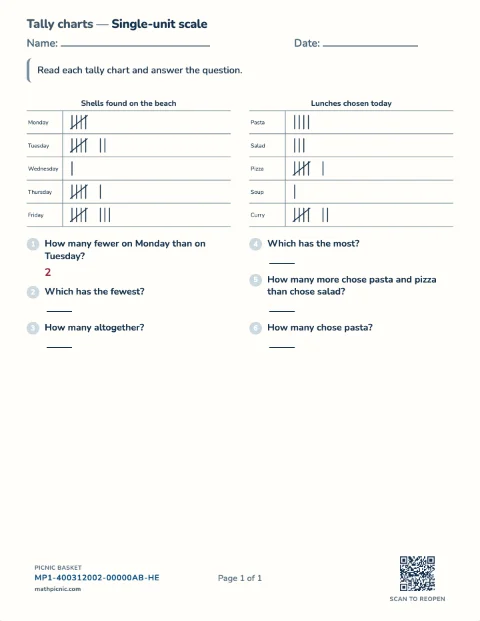 Print ∣∣∣∣ = ?
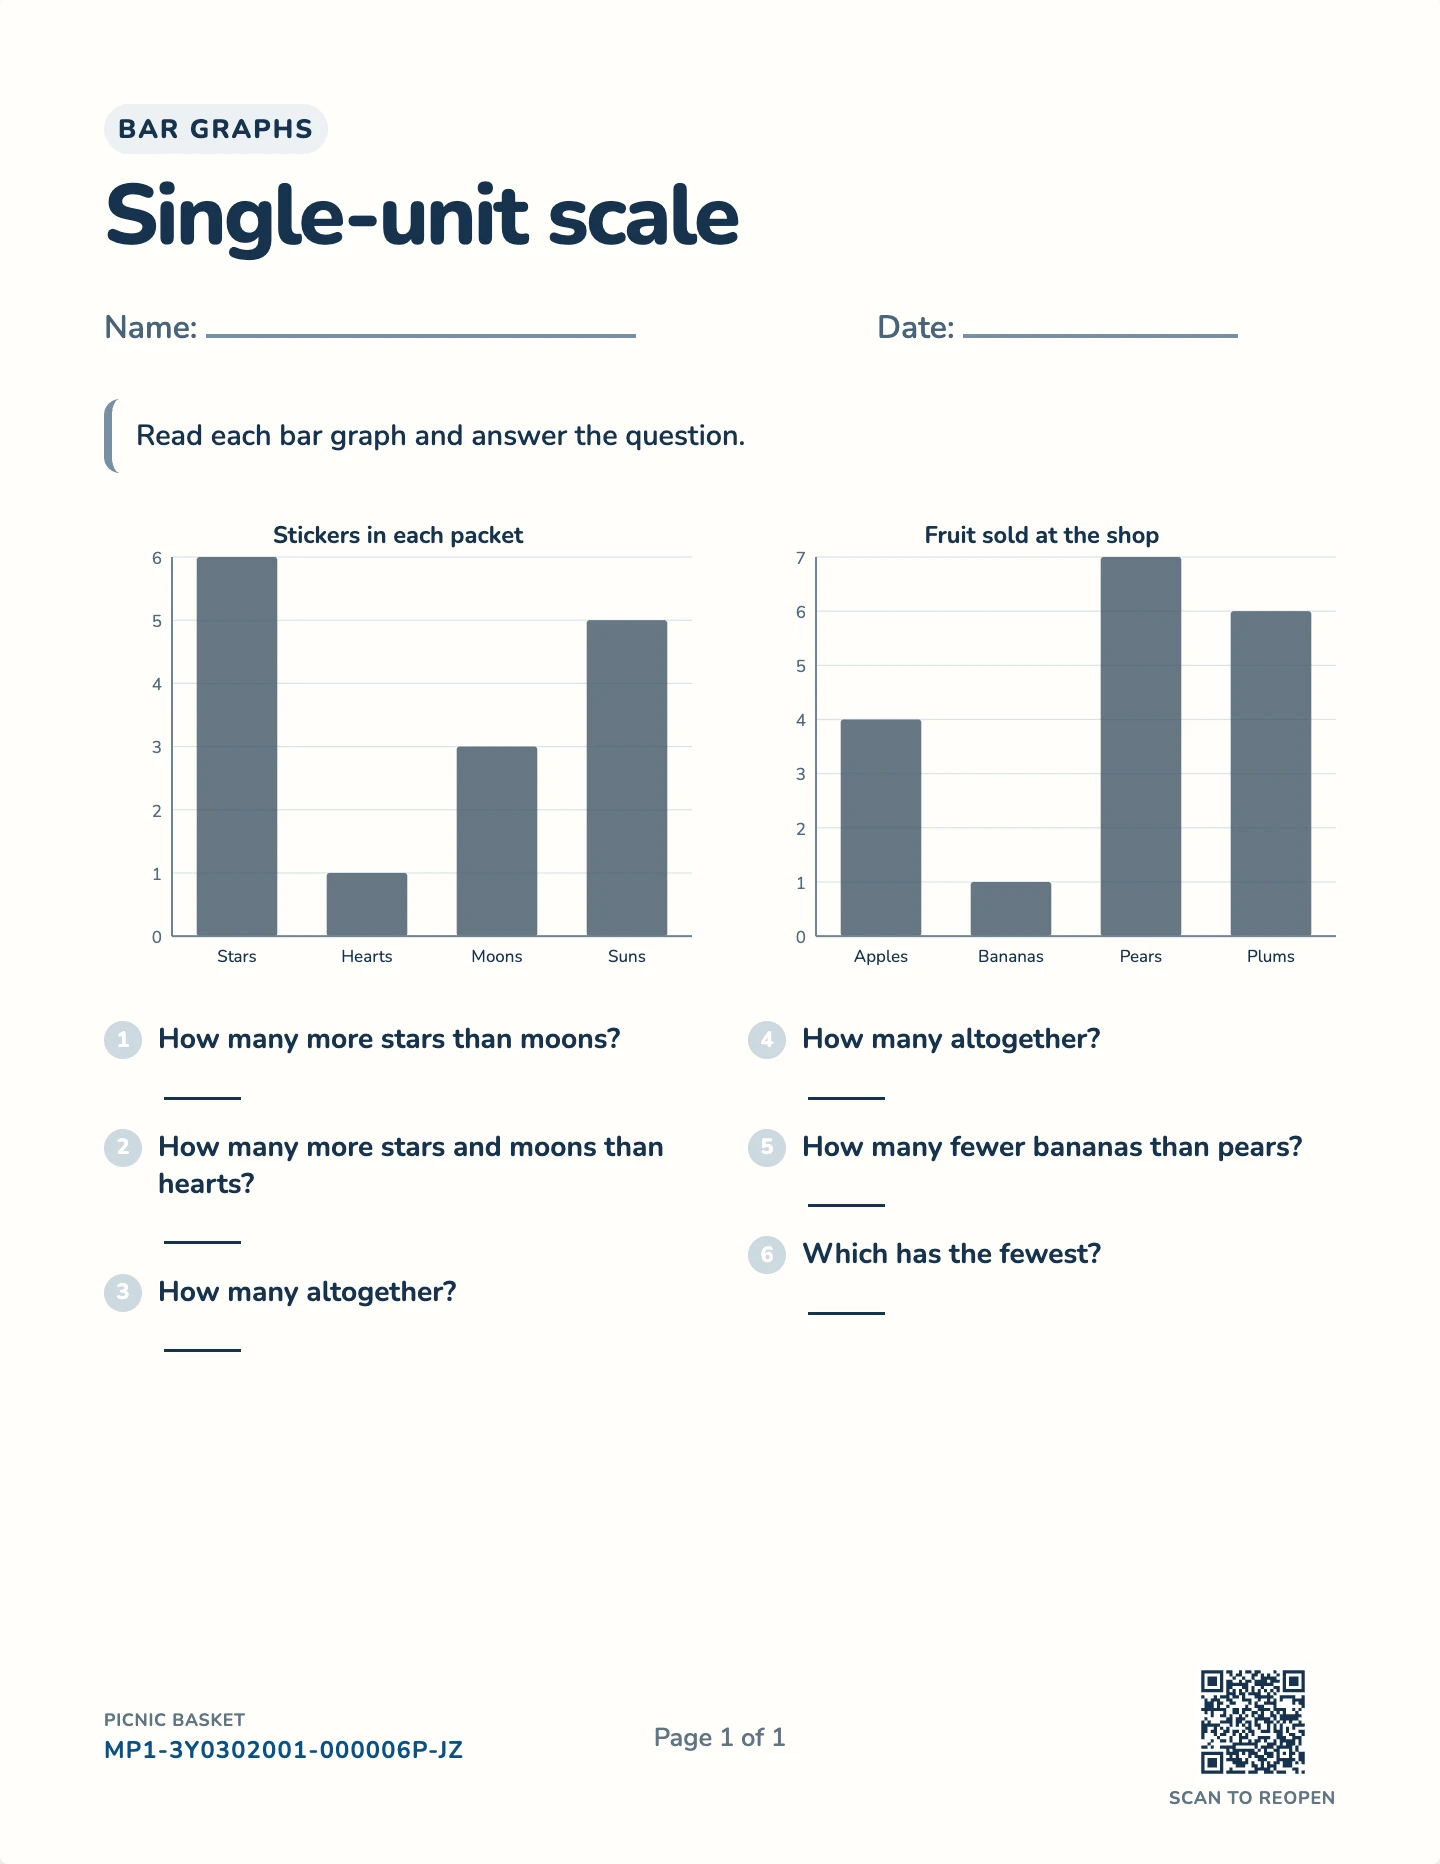
 - Bar graphs
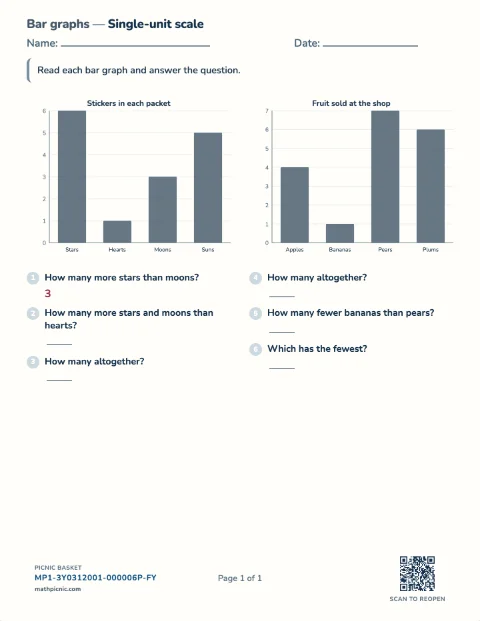 Print How many more?
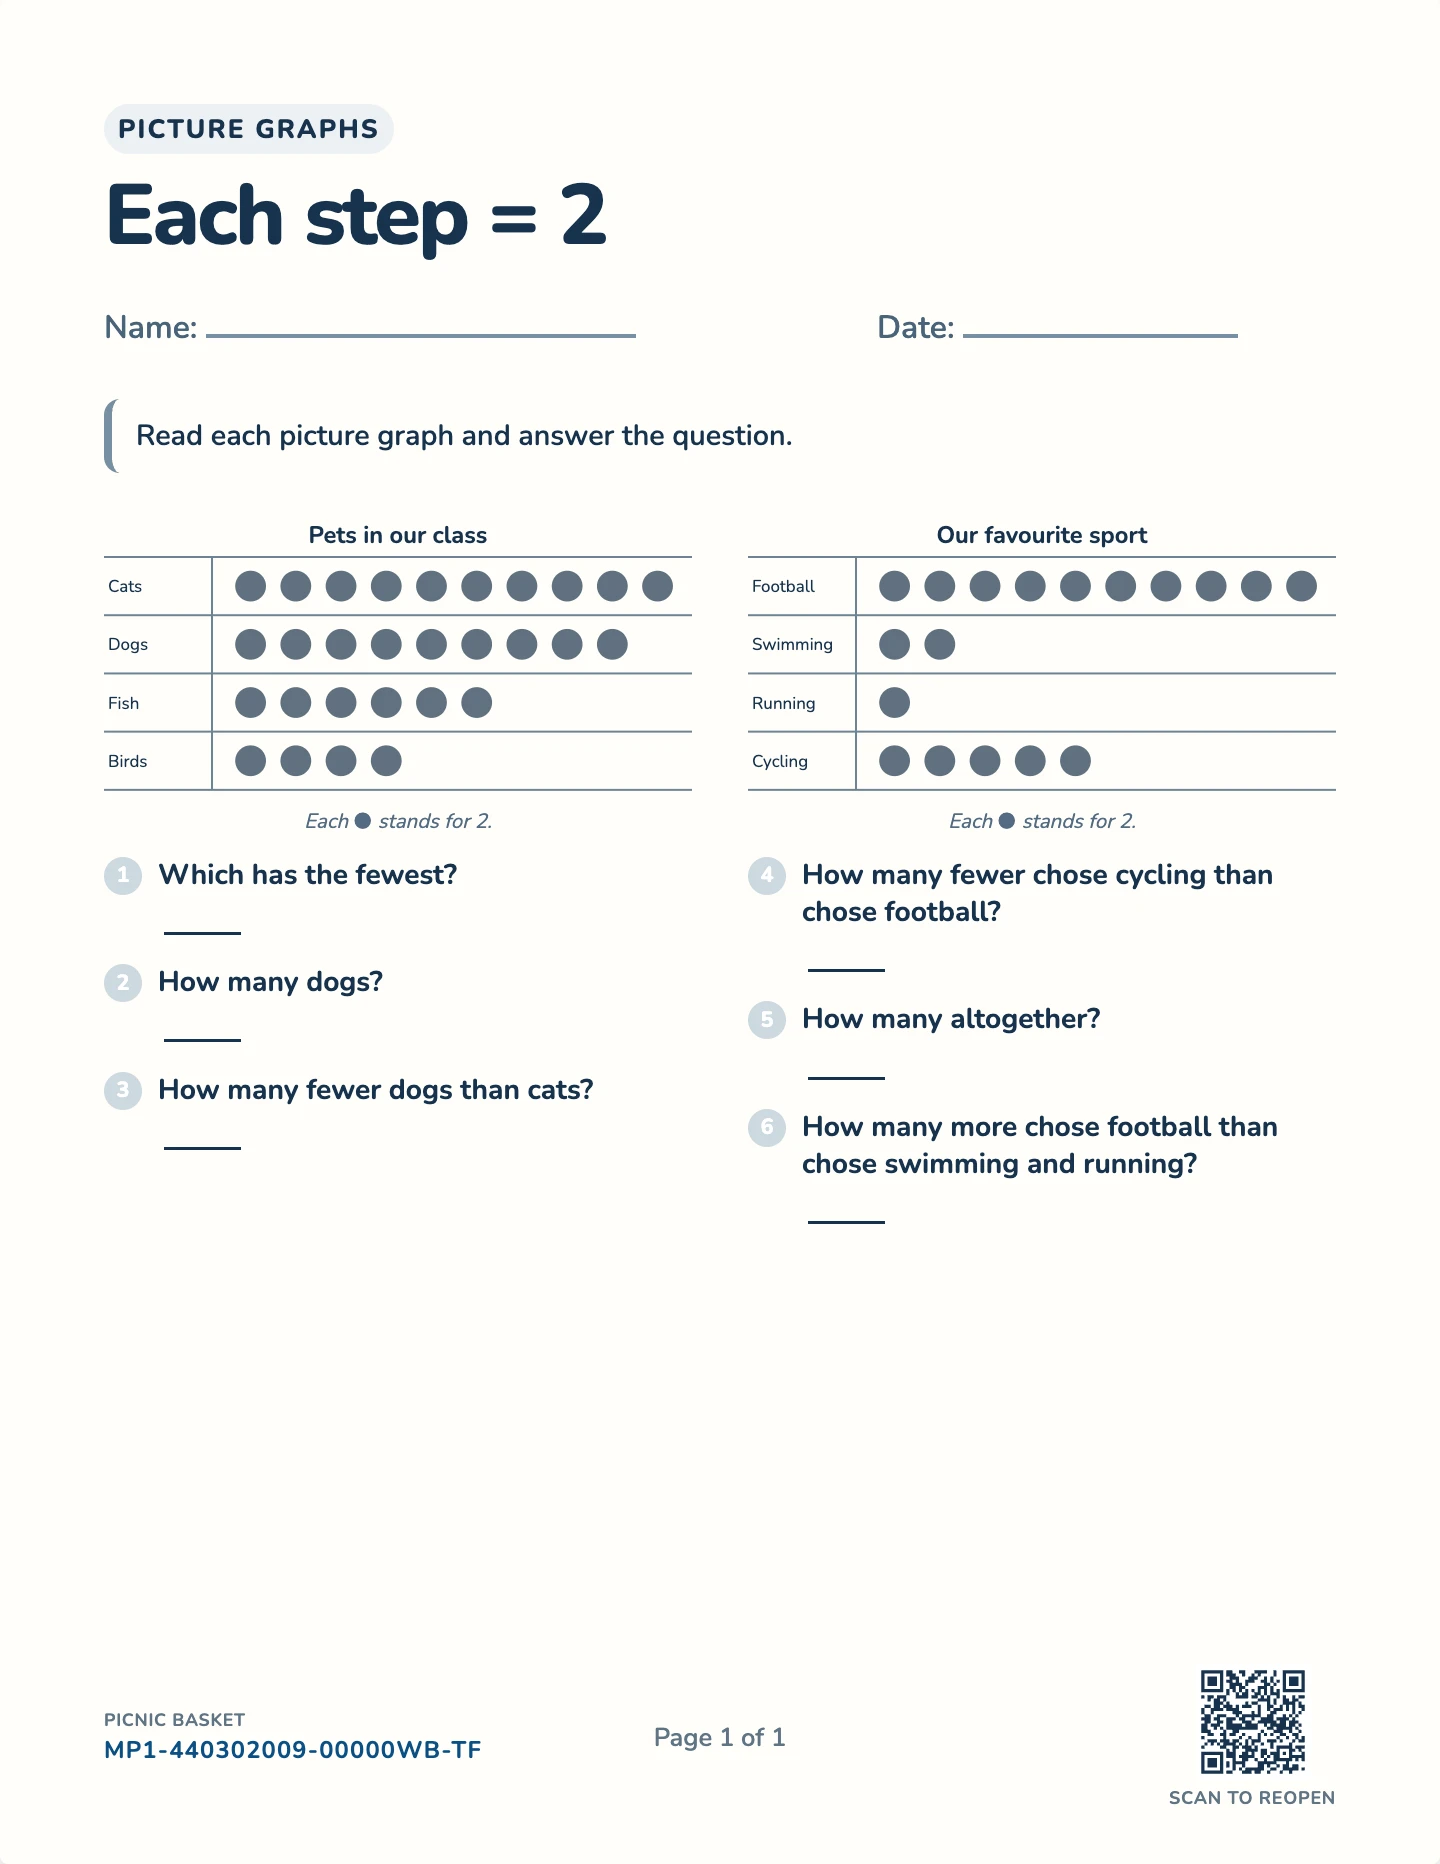
 - Picture graphs
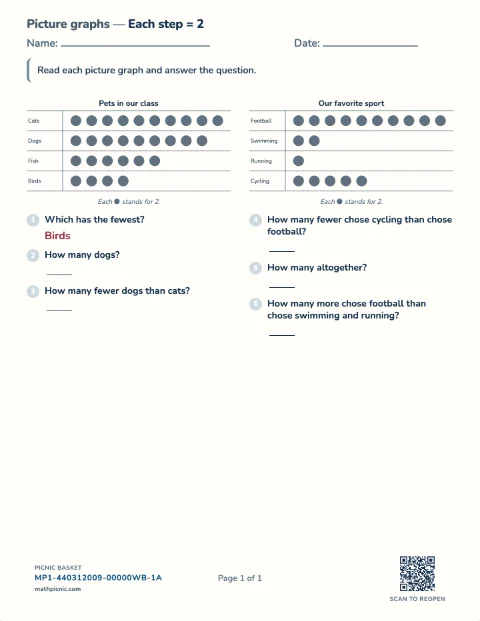 Print = ?
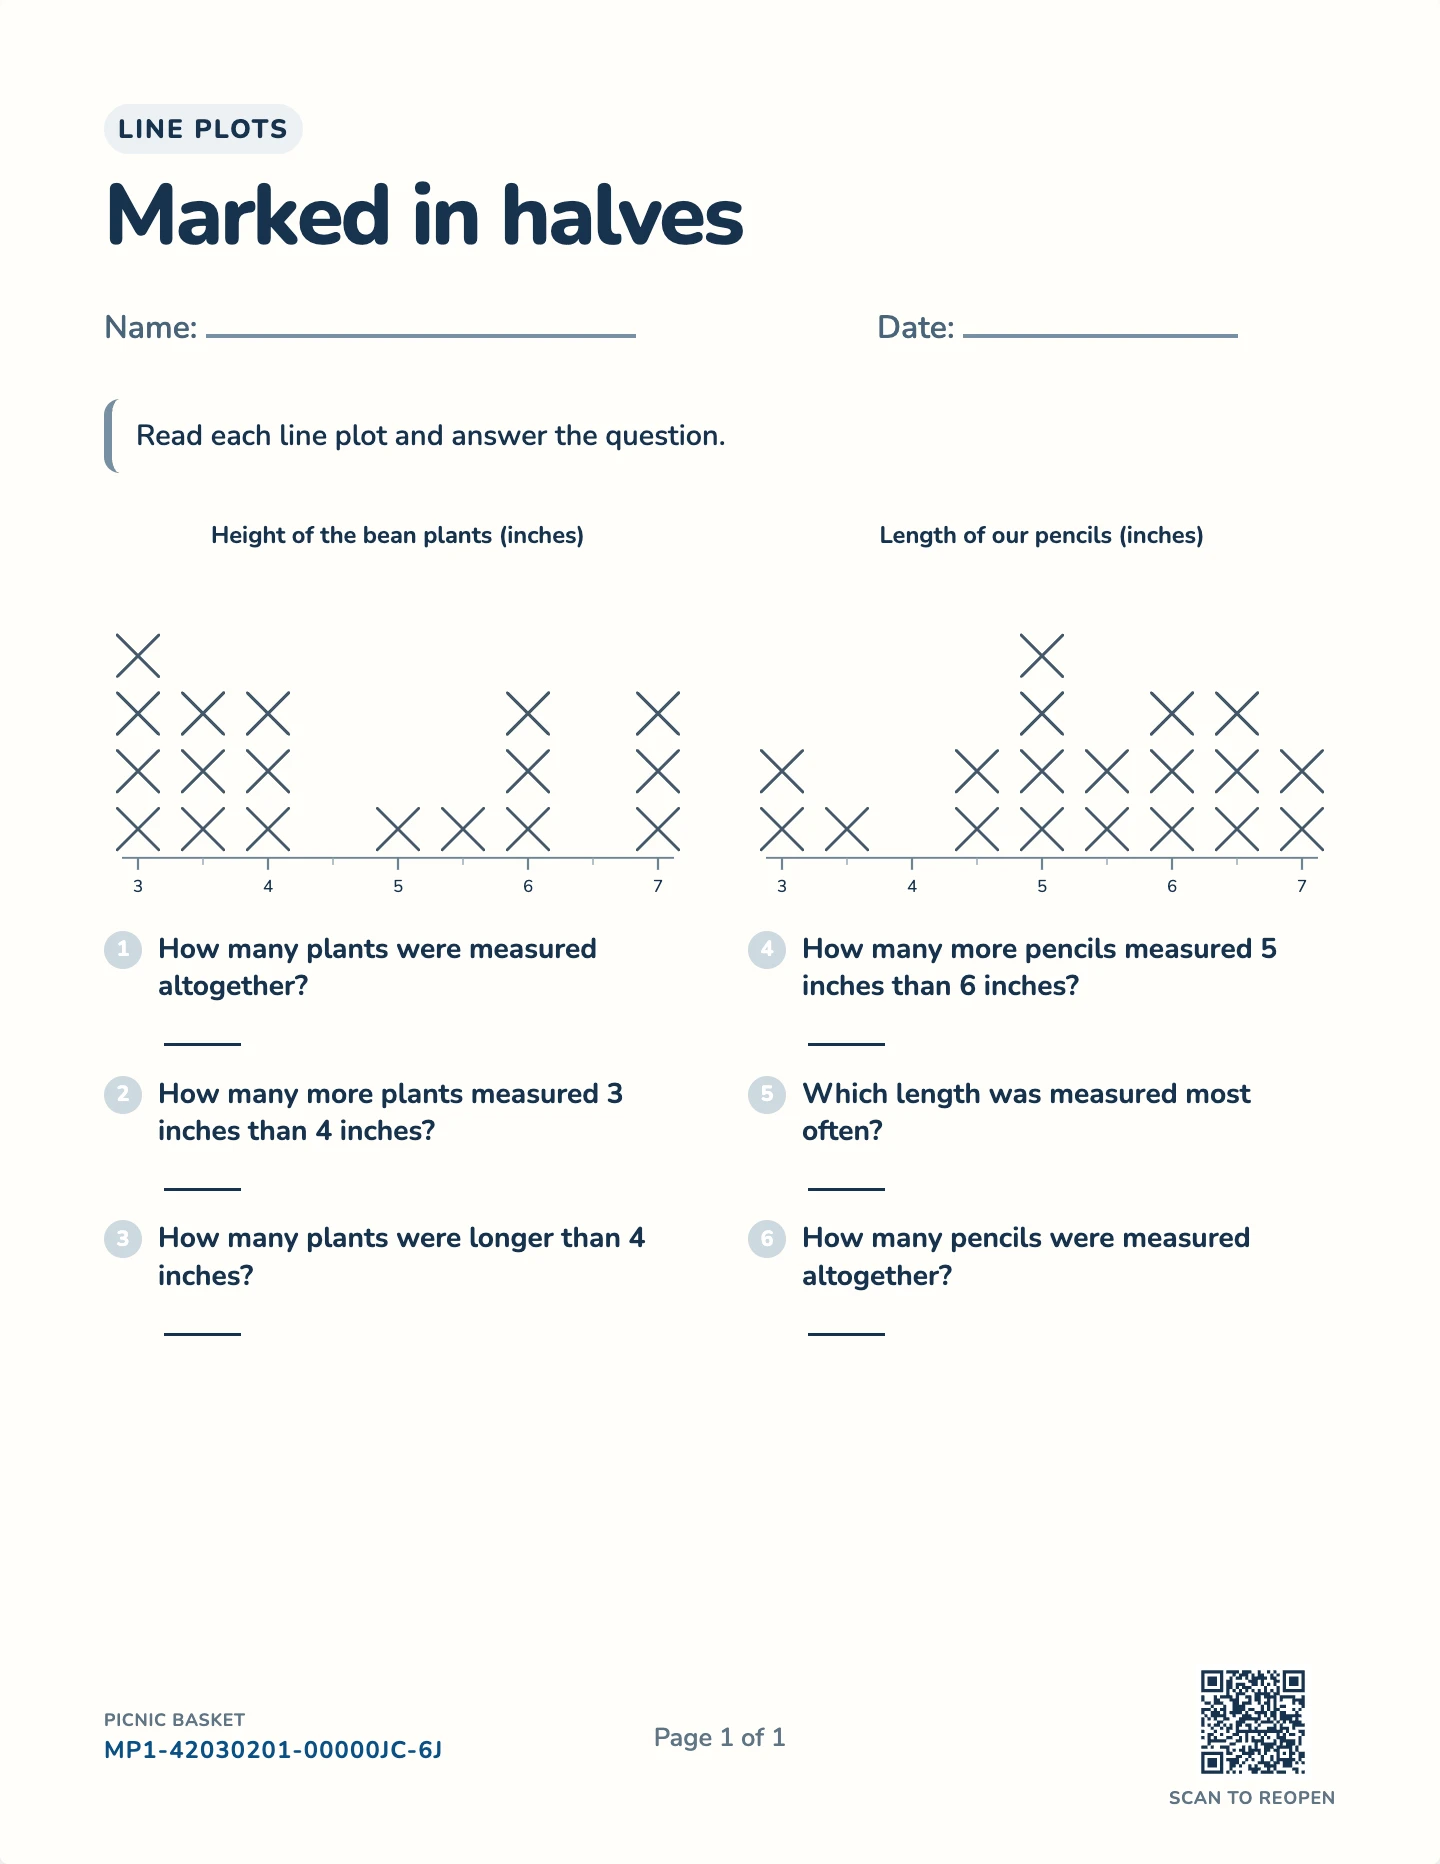
 - Line plots
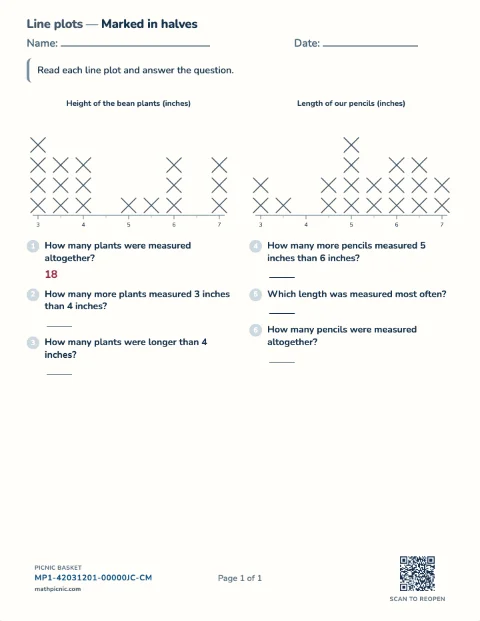 Print How many at 3½?
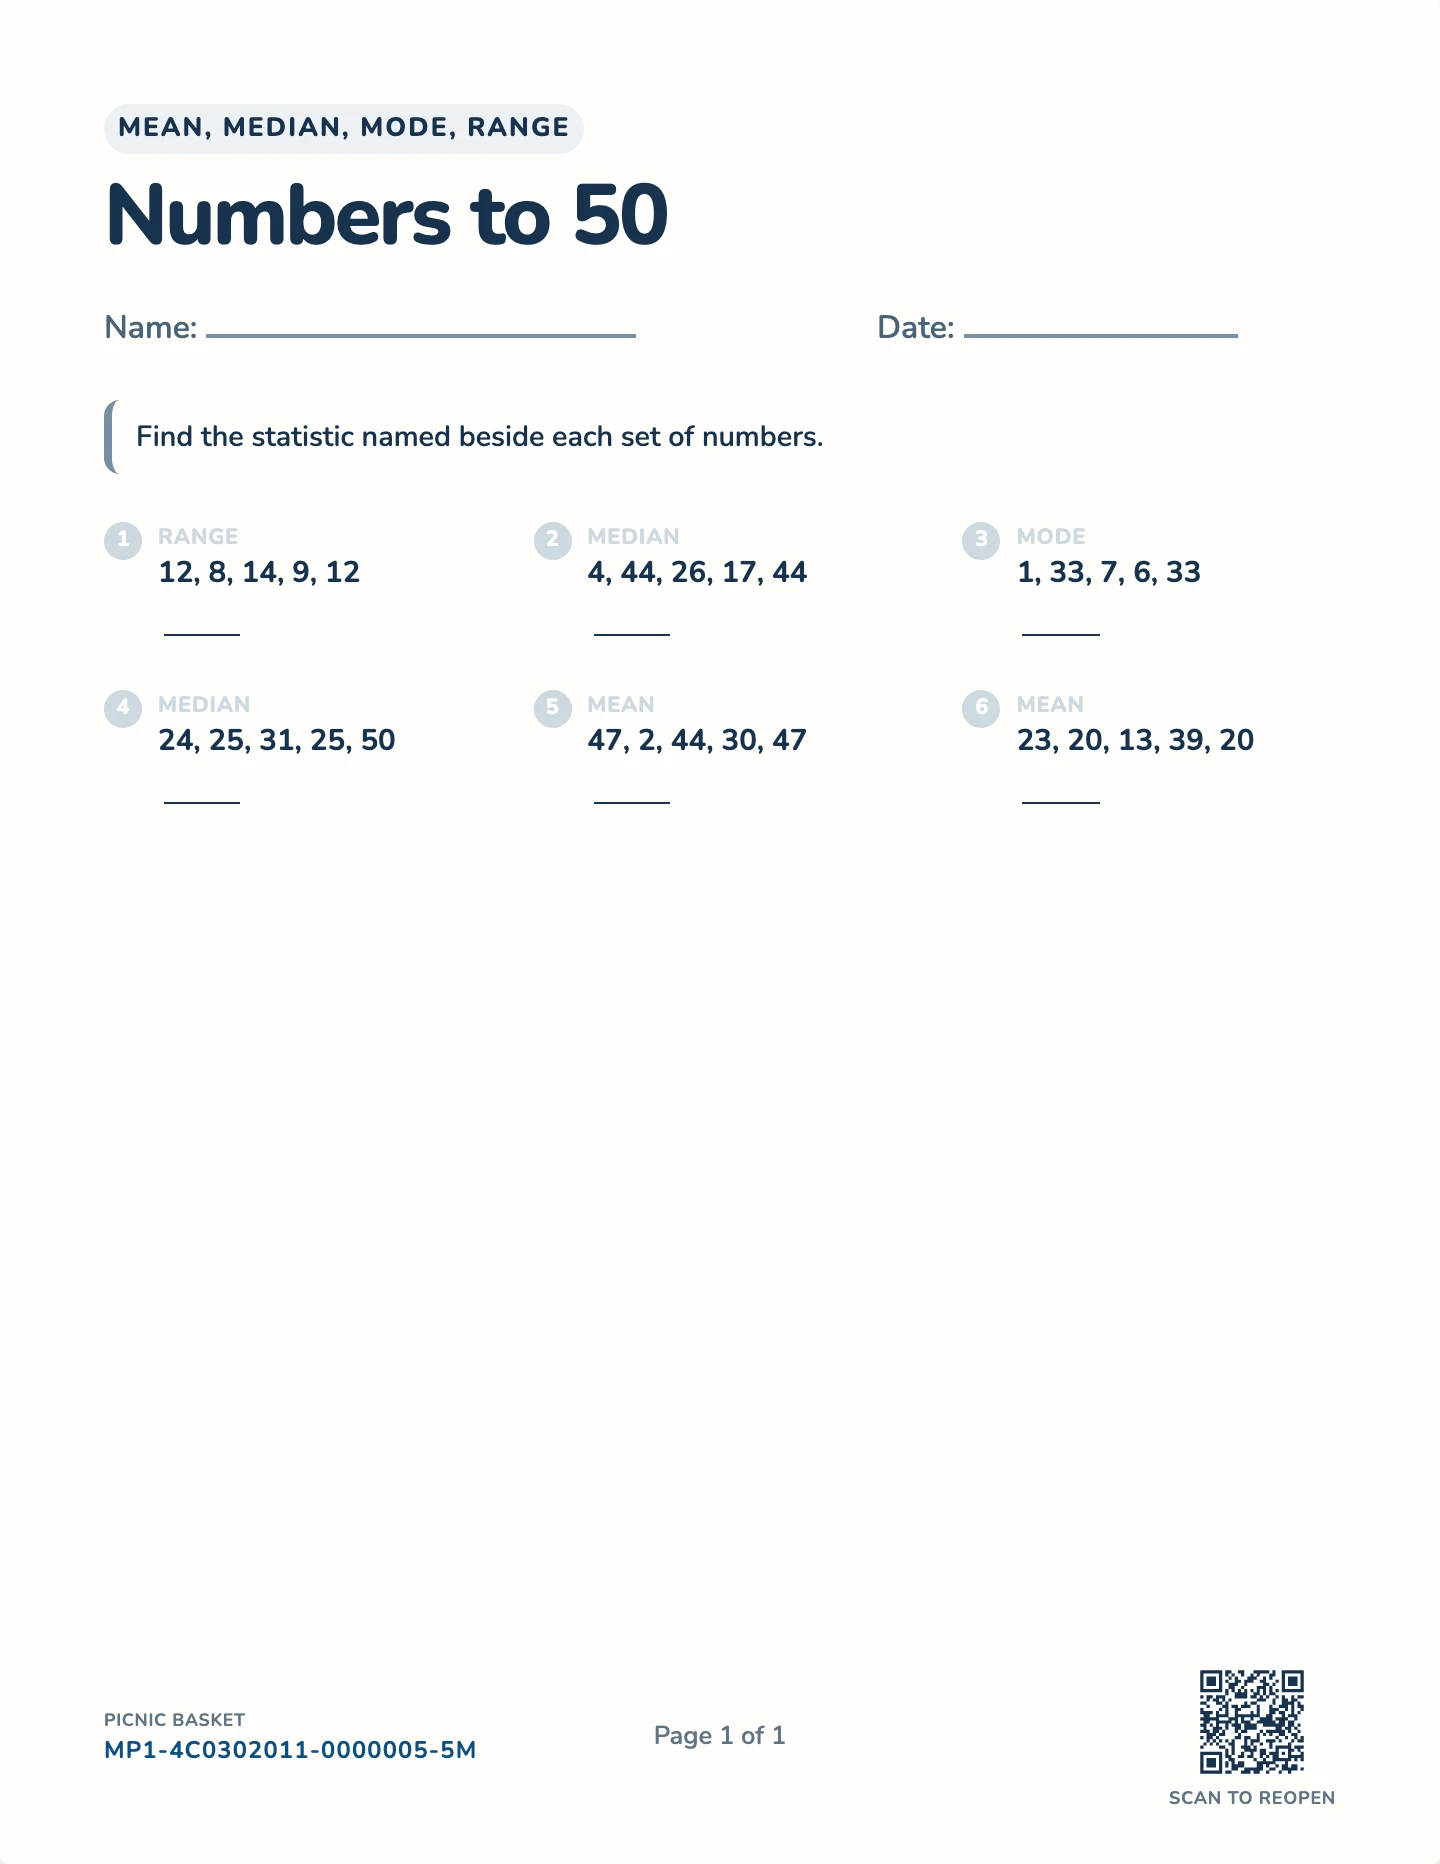
 - Mean, median, mode, and range
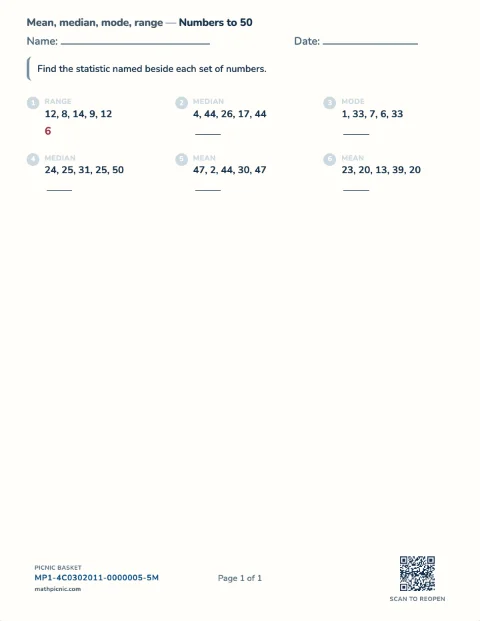 Print Mean of 4, 7, 3, 6, 5
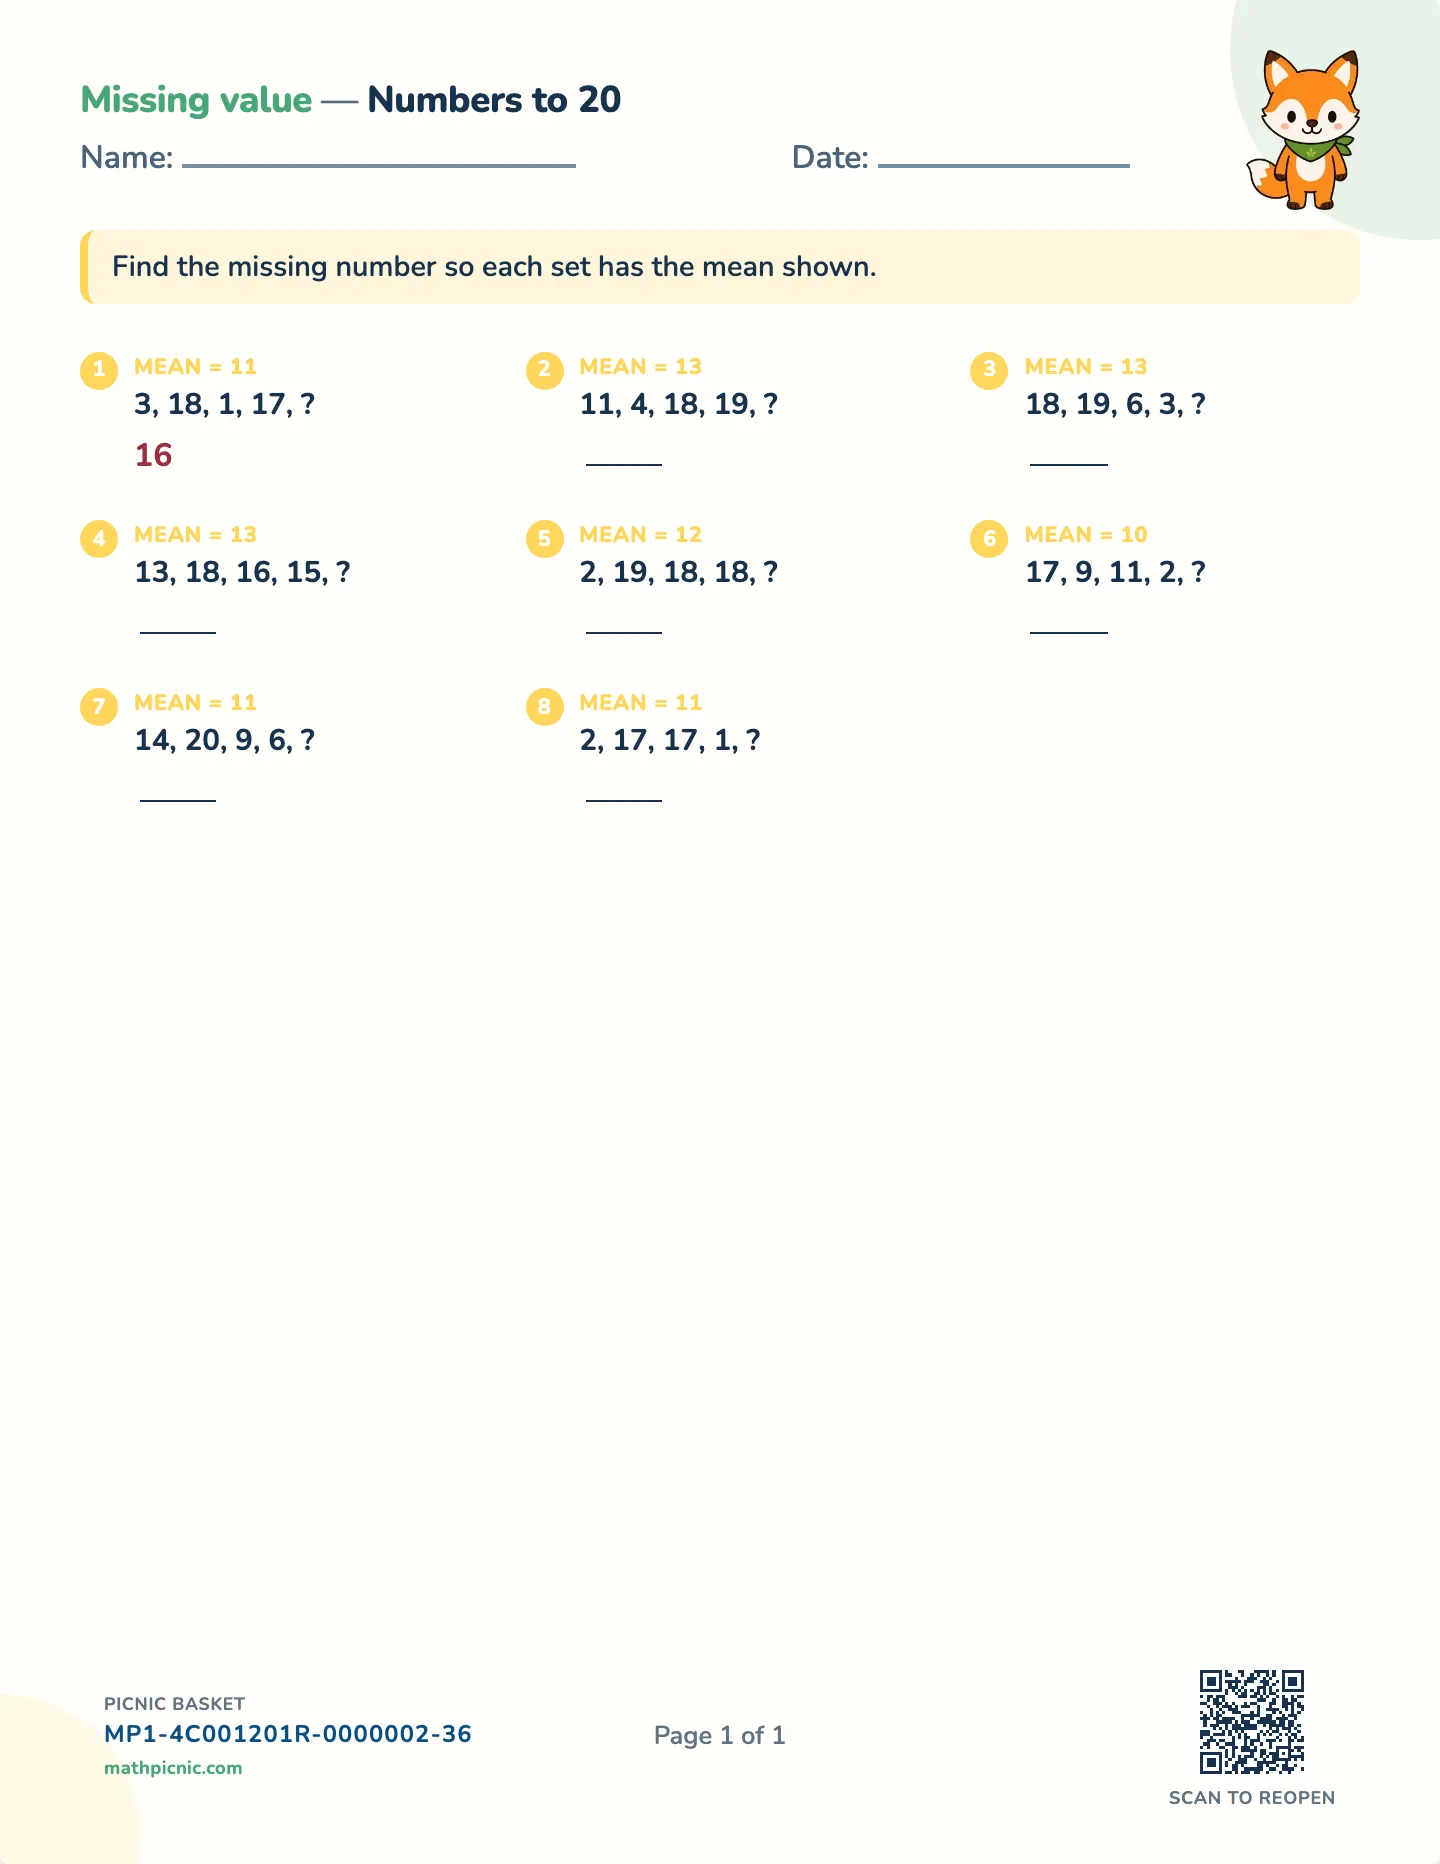
 - Missing number from the mean
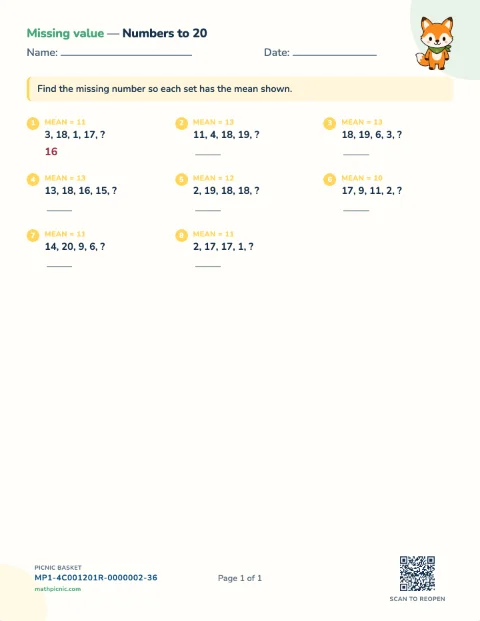 Print 6, 7, 9, 10, □ → mean 8
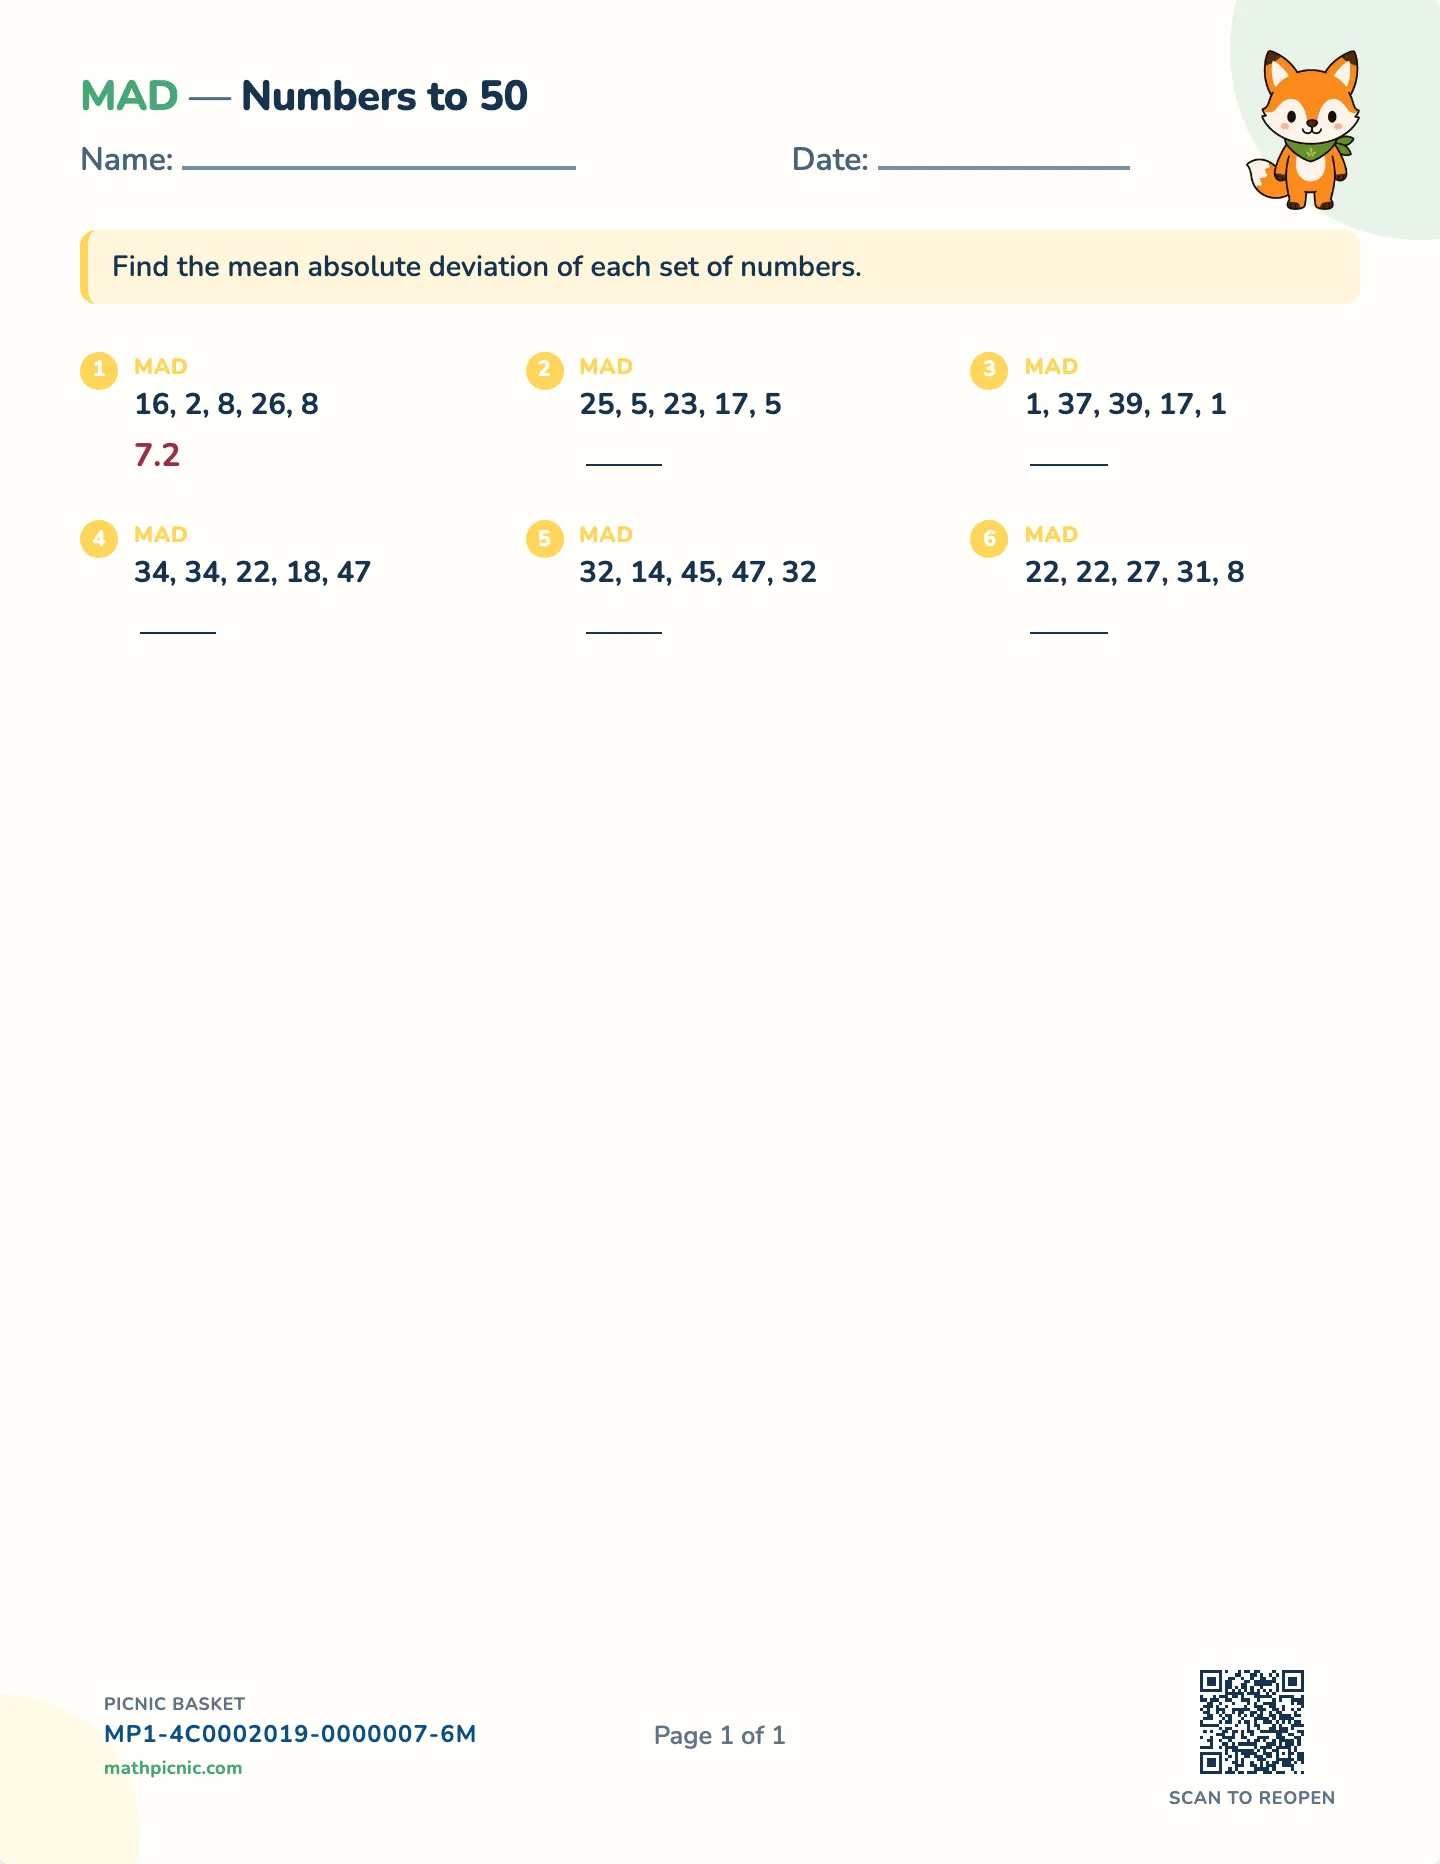
 - Mean absolute deviation
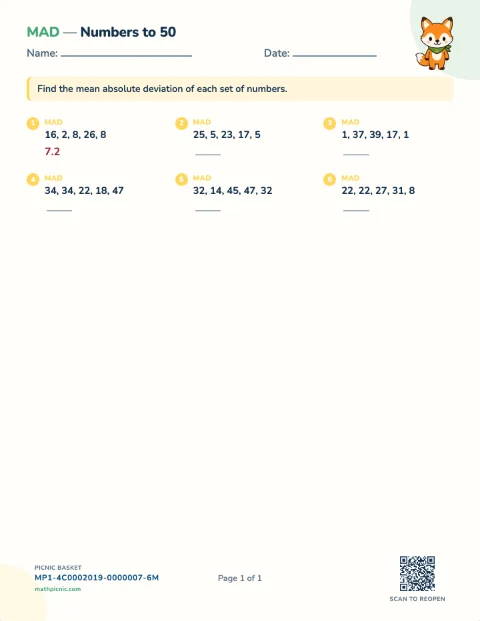 Print 2, 4, 4, 5, 10 → 2.4
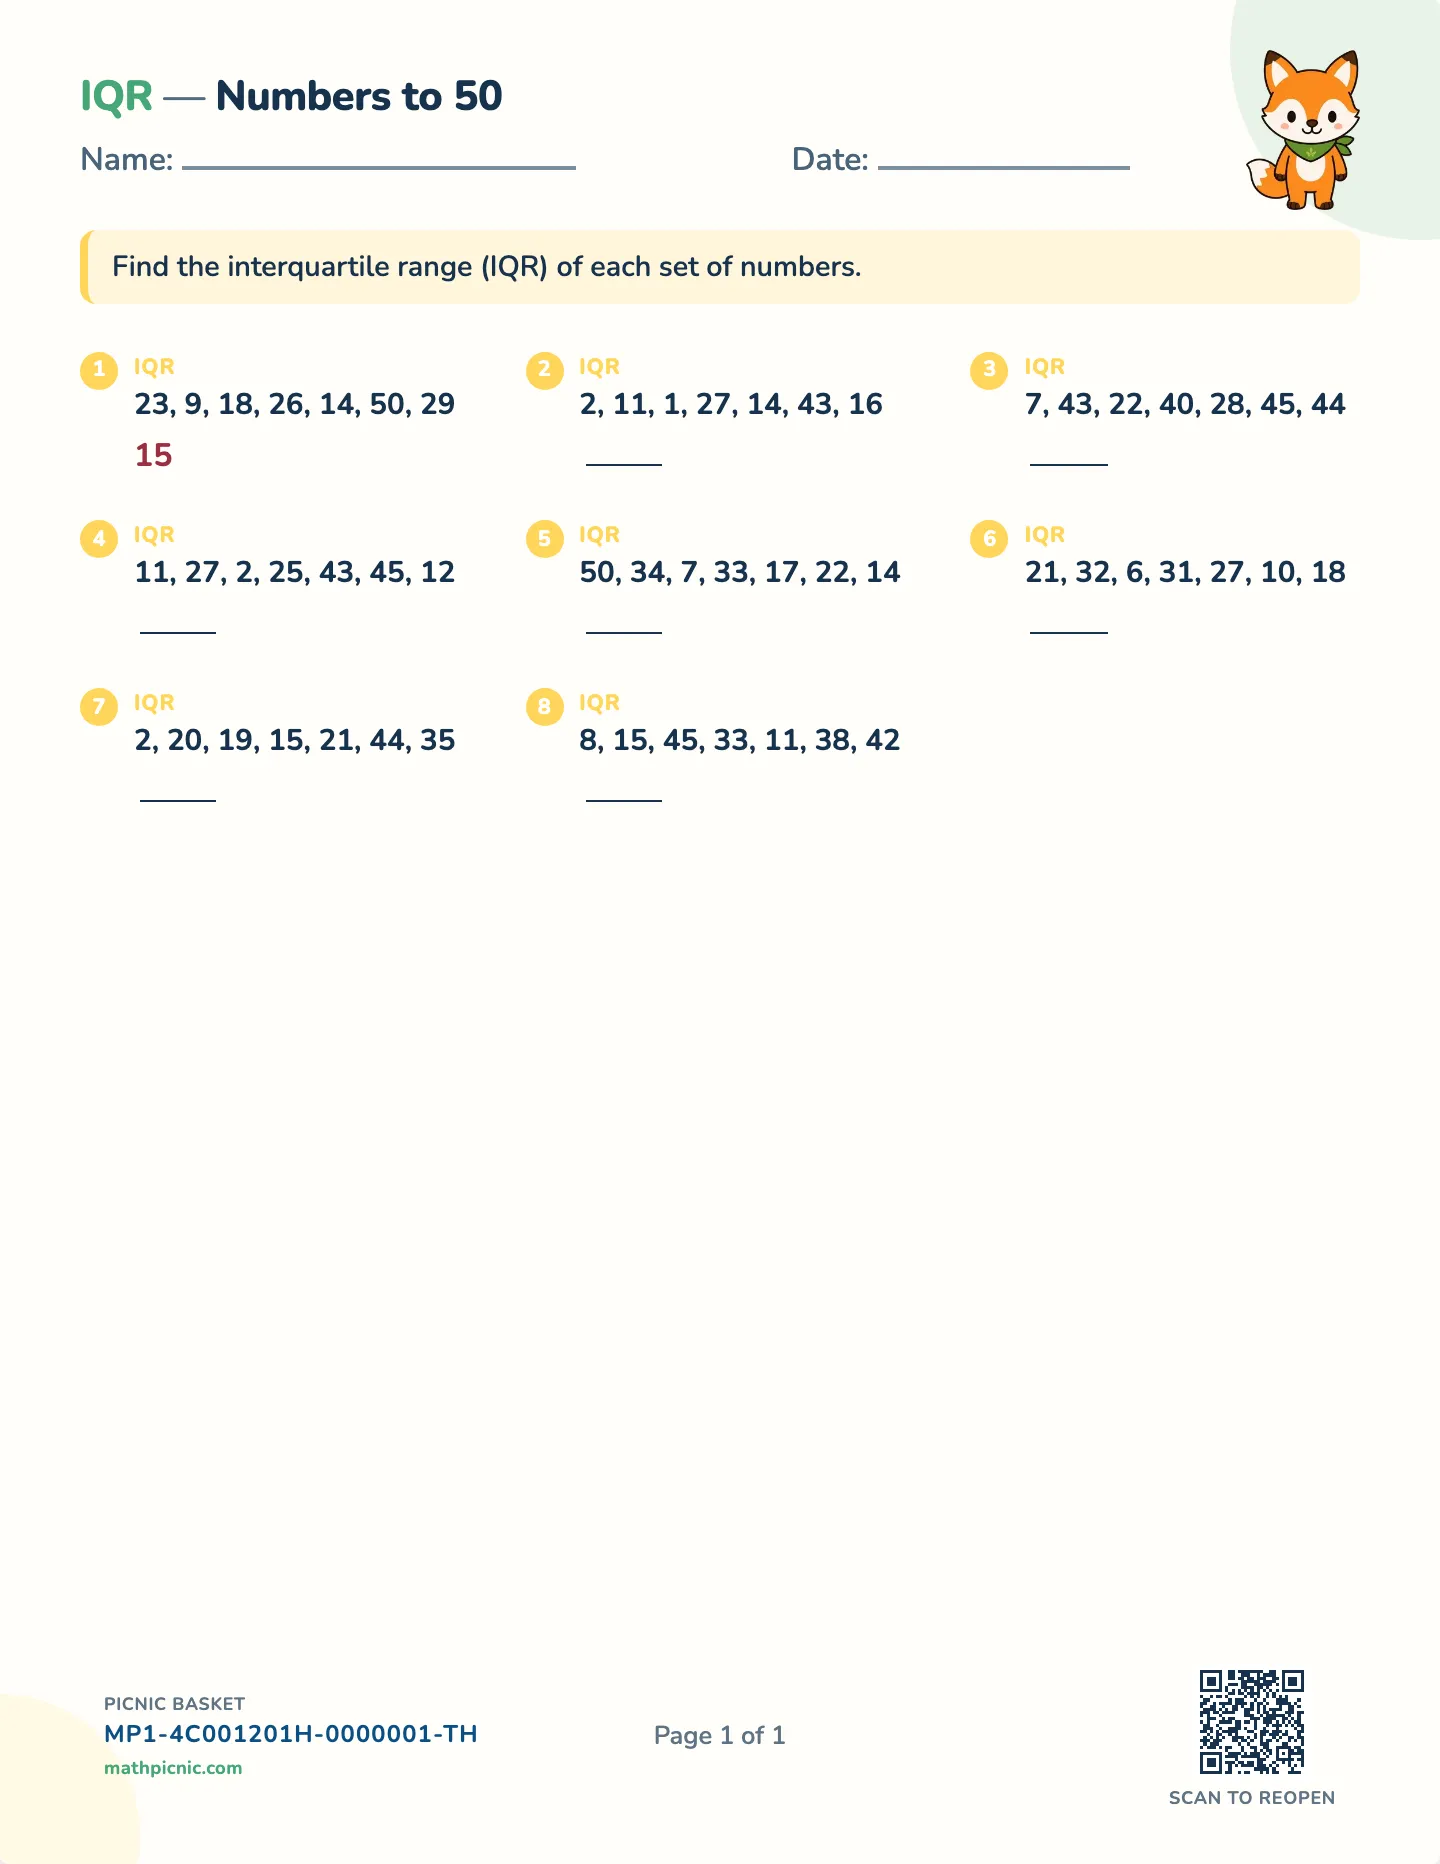
 - Interquartile range
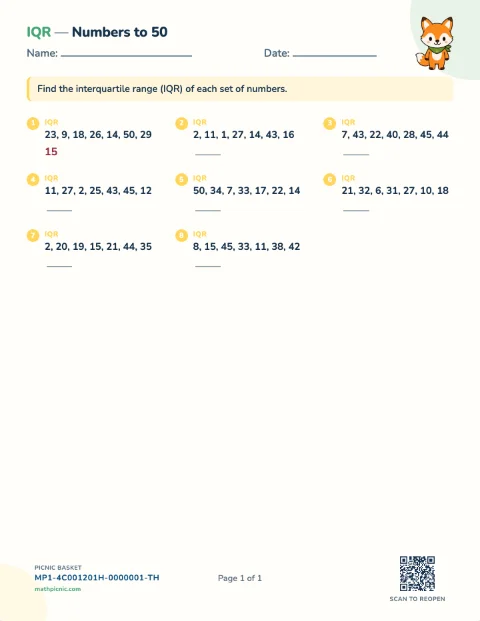 Print 4, 7, 13, 23, 26, 41, 47 → 34
 - Predicting counts from probability
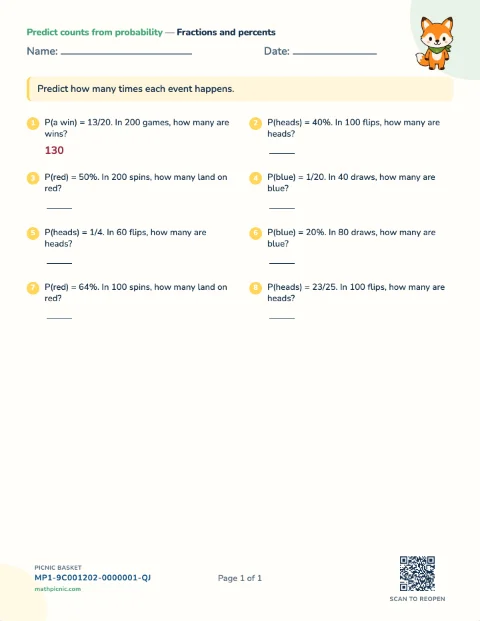 Print P(red) = 3/10, 200 spins → 60
 - The counting principle
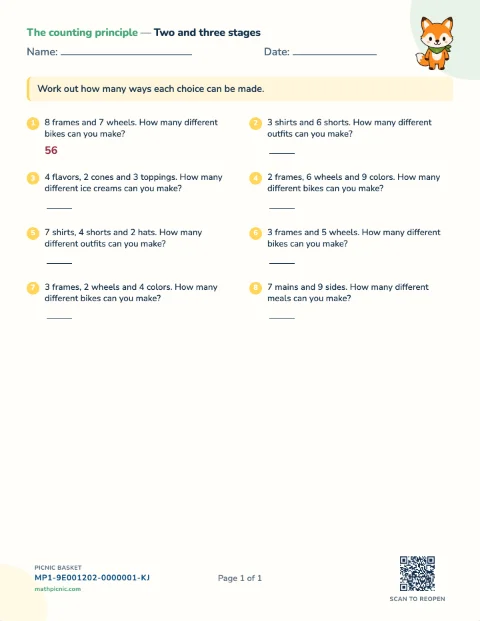 Print 4 shirts, 3 shorts → 12
 - Two rules, two patterns
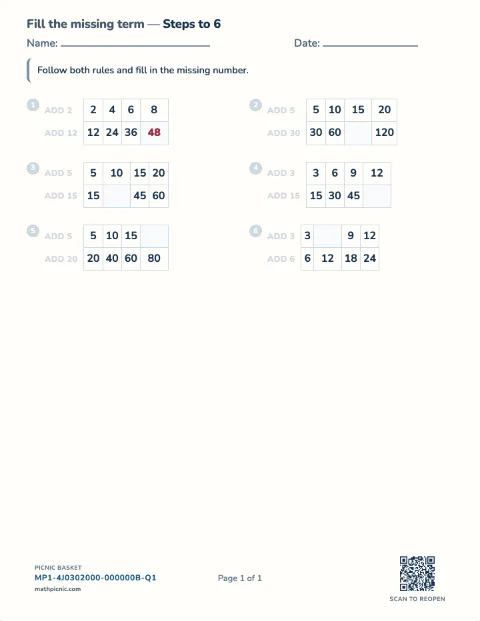 Print Add 3 / Add 9
 - Points on a coordinate grid
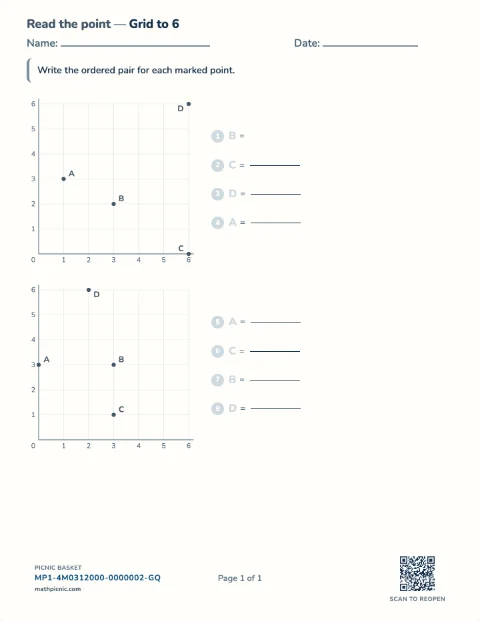 Print A = (3, 5)
 - Two-way tables
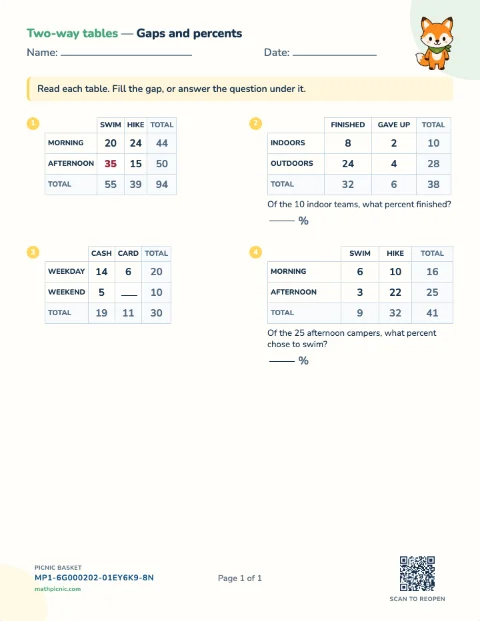 Print Grade 7 / Pet / Total
 - Circle graphs
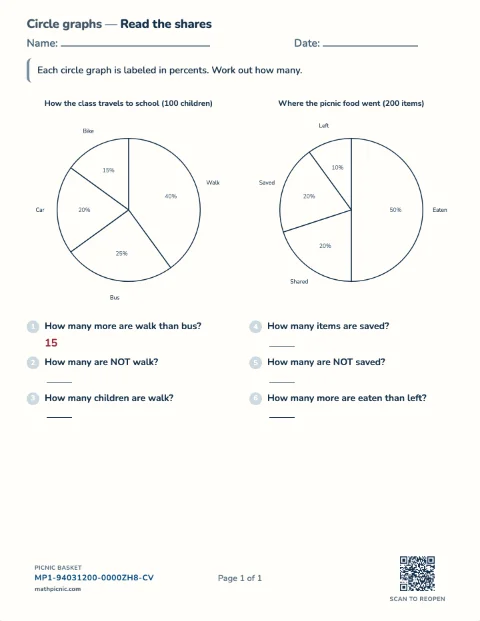 Print 25% of 200 = __
 - Histograms
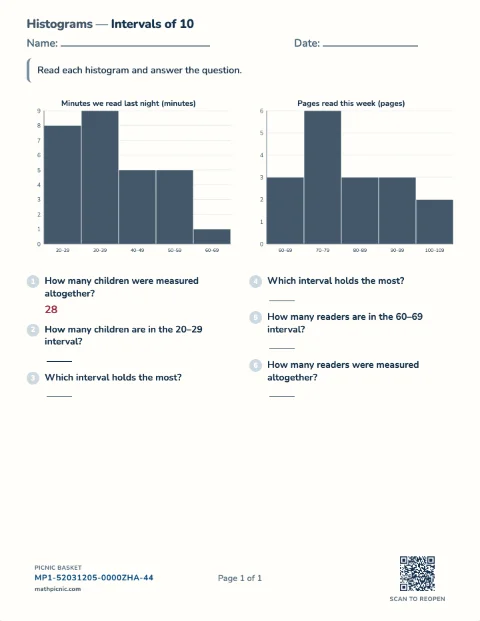 Print 20–29 → how many?
 - Stem-and-leaf plots
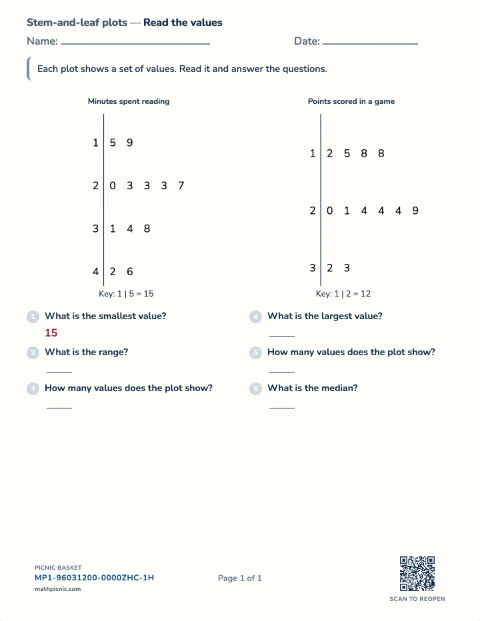 Print 3 | 1 2 5 → 31, 32, 35
 - Box plots
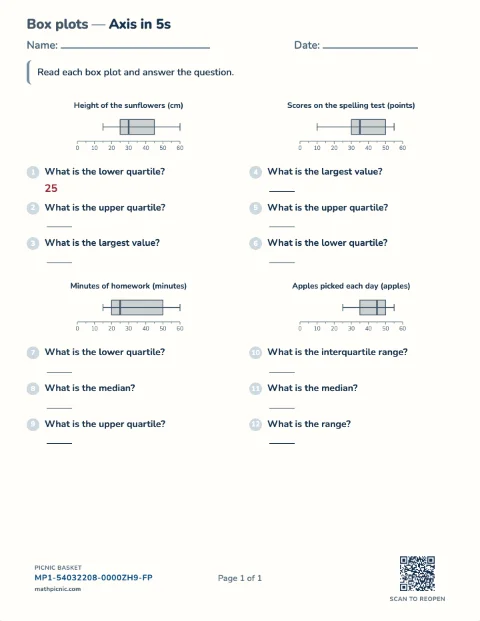 Print median → __
 - Probability
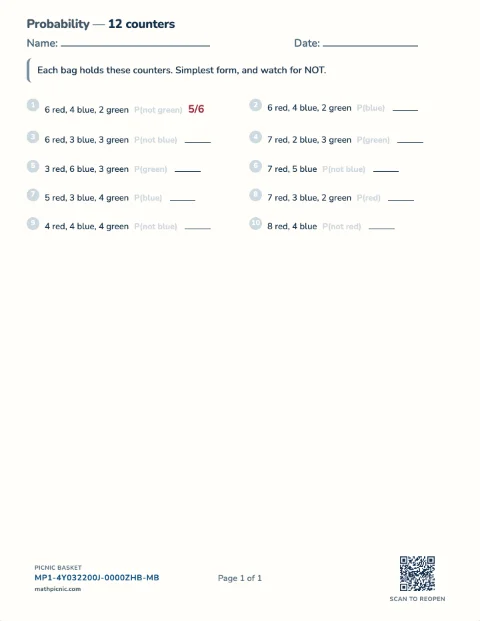 Print 4 blue of 12 → 1/3
 - Scatter plots
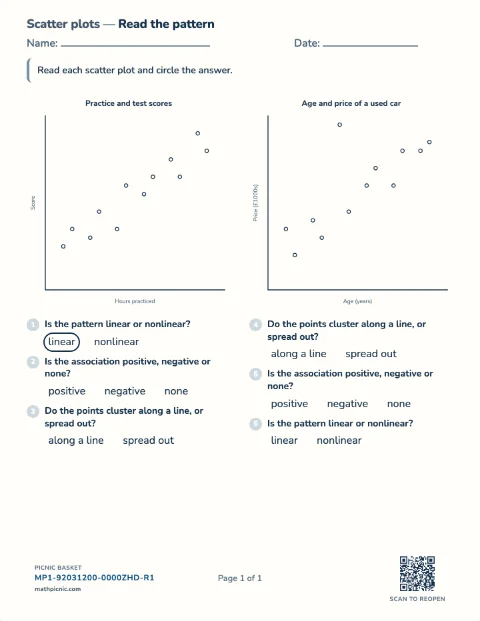 Print rising cloud → positive
 - Finding the mean
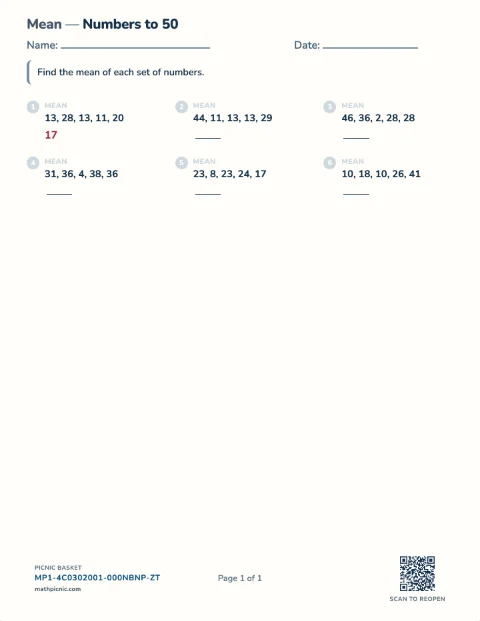 Print mean of 4, 7, 3, 6, 5 → 5
 - Finding the median
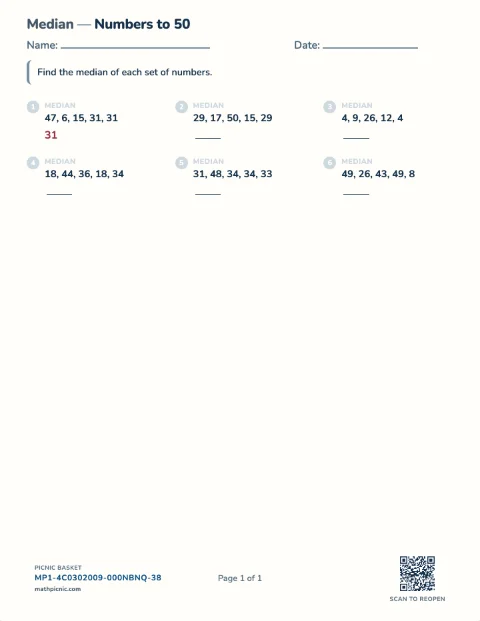 Print 3, 8, 4, 6, 9 → 6
 - Finding the mode
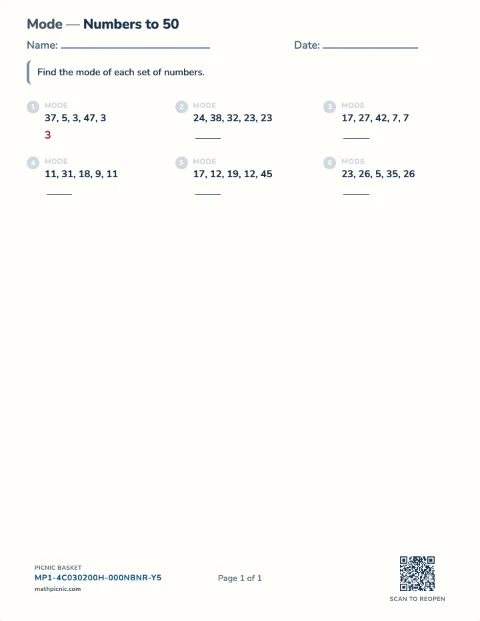 Print 2, 5, 5, 7, 9 → 5
 - Range of a data set
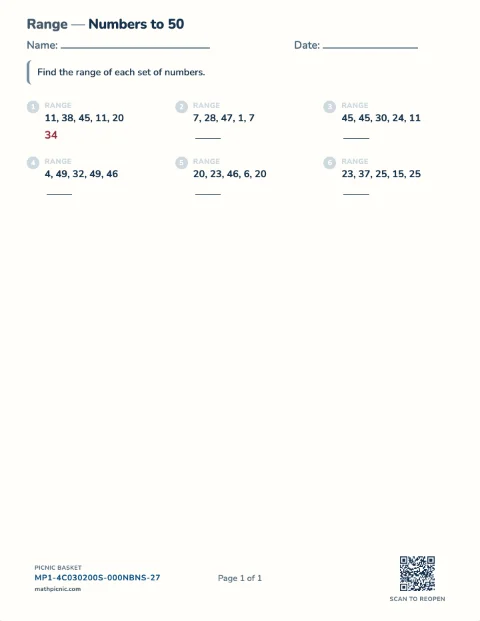 Print 3, 9, 4, 12, 7 → 9
 - Plotting points
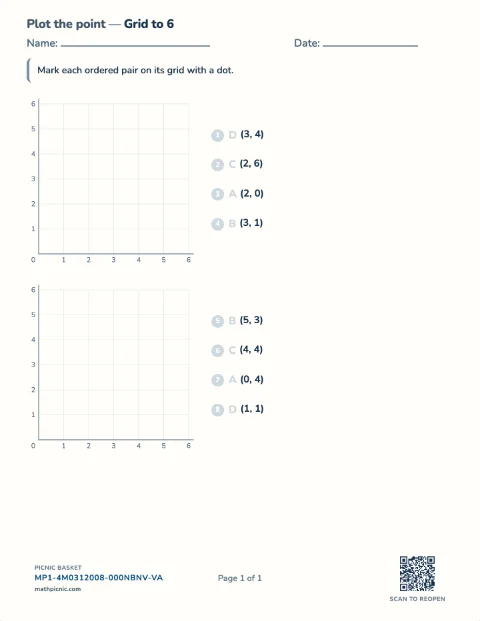 Print plot (3, 5)
 - Completing two-way tables
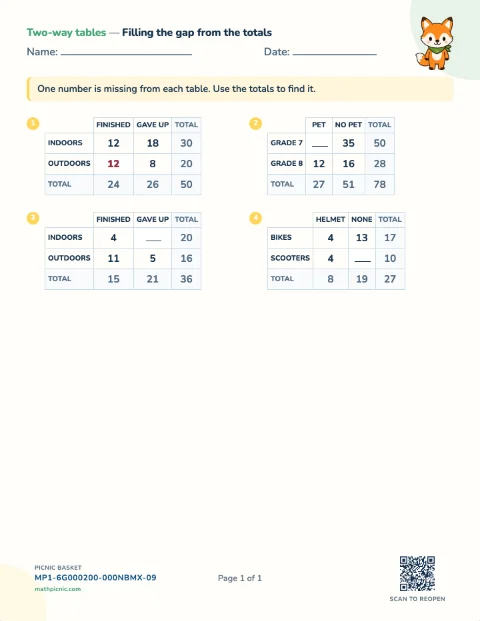 Print row total 25, cells 18 + ▢
 - Relative frequency
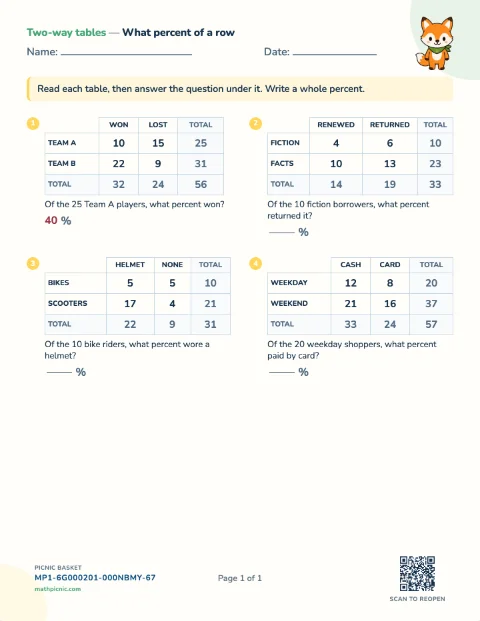 Print 18 of 25 → 72%
 - Simple probability
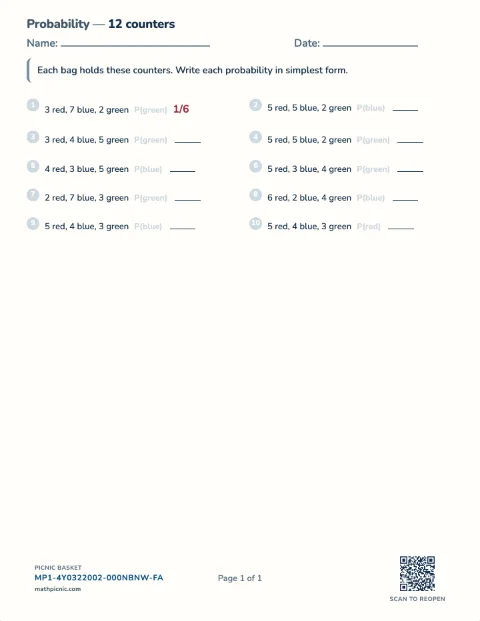 Print 3 red of 12 → 1/4
 - Complementary events
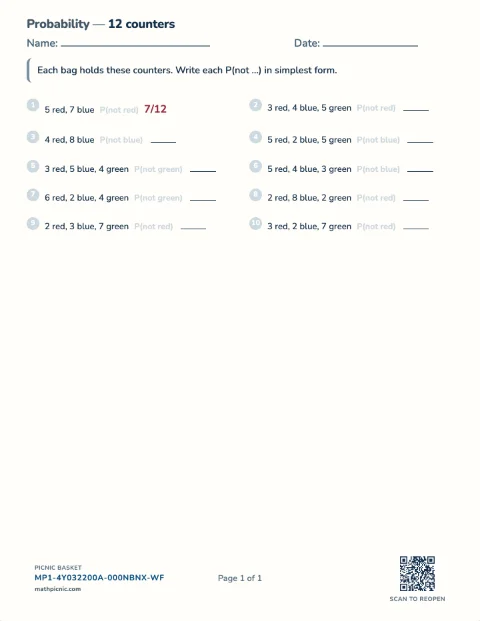 Print P(red) = 1/4 → P(not) = 3/4
 - Reading box plots
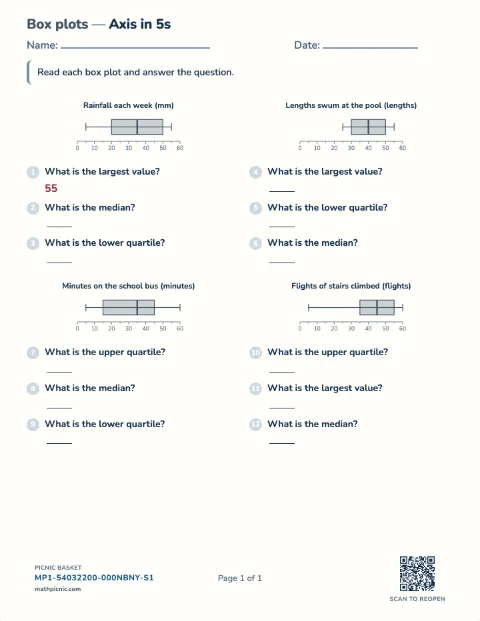 Print Q1 → __
 - Box plot range and IQR
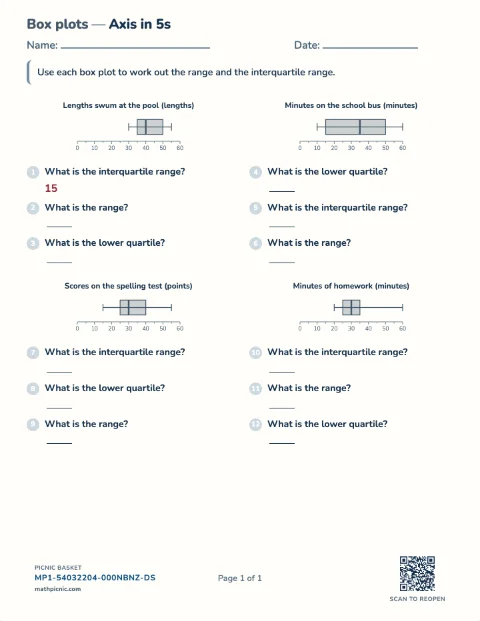 Print box width → IQR
 - Relating two number patterns
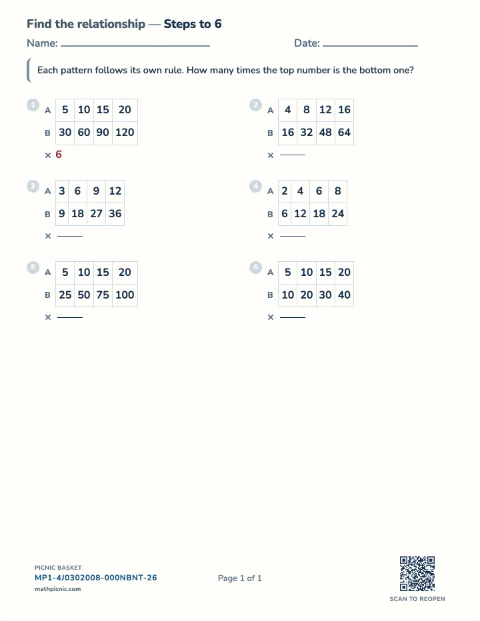 Print top × 3 = bottom
 - Two-stage counting principle
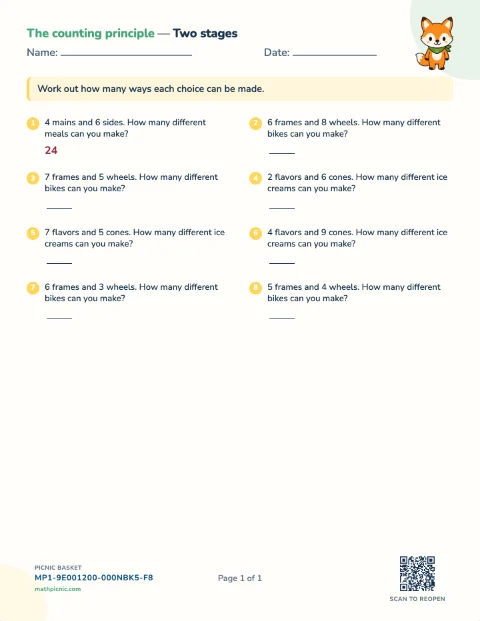 Print 4 shirts × 3 shorts → 12
 - Three-stage counting principle
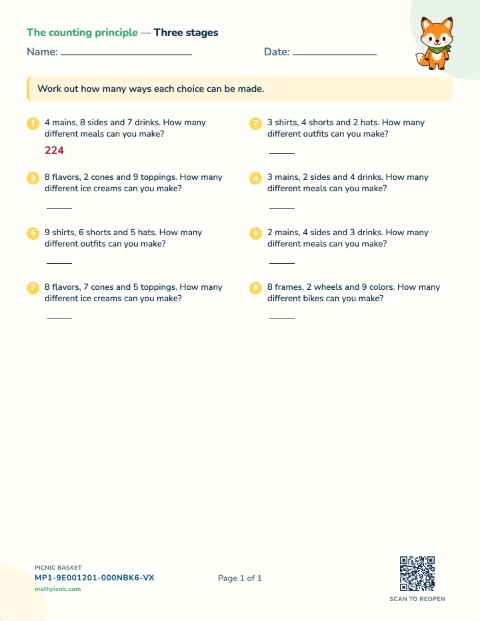 Print 3 × 2 × 4 → 24
 - Predicting counts from a fraction
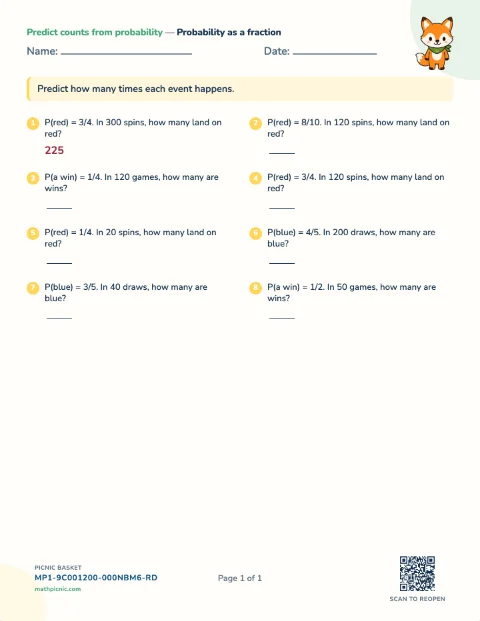 Print 3/10 of 200 → 60
 - Predicting counts from a percent
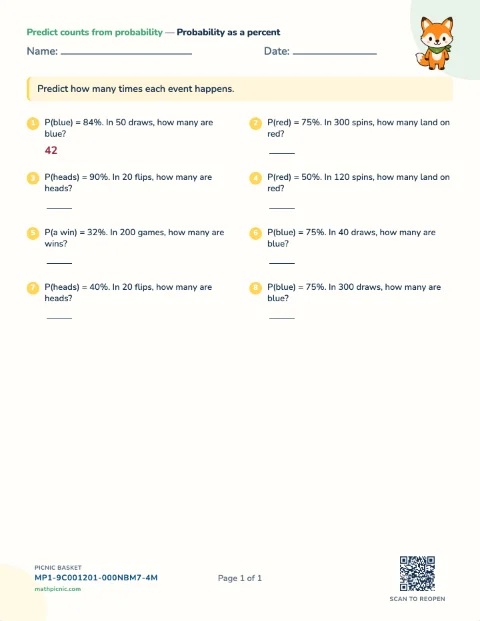 Print 30% of 200 → 60
A simple way through graphs and data
Data is the one strand where the picture IS the question. Take the graph away and nothing is left to answer, which is why these sheets give the chart and ask about it rather than asking a child to draw one — drawing is a classroom job with something real to count, and a printable cannot mark it.
Why this order works
The four charts are one idea at four resolutions. A tally counts in fives, a picture graph counts symbols against a key, a bar graph reads a height against a scale, and a line plot puts the measurements themselves on a number line. A child who can read one is most of the way to reading the next, and the scale — ones, twos, fives, tens — is what moves each of them from grade 2 to grade 3.