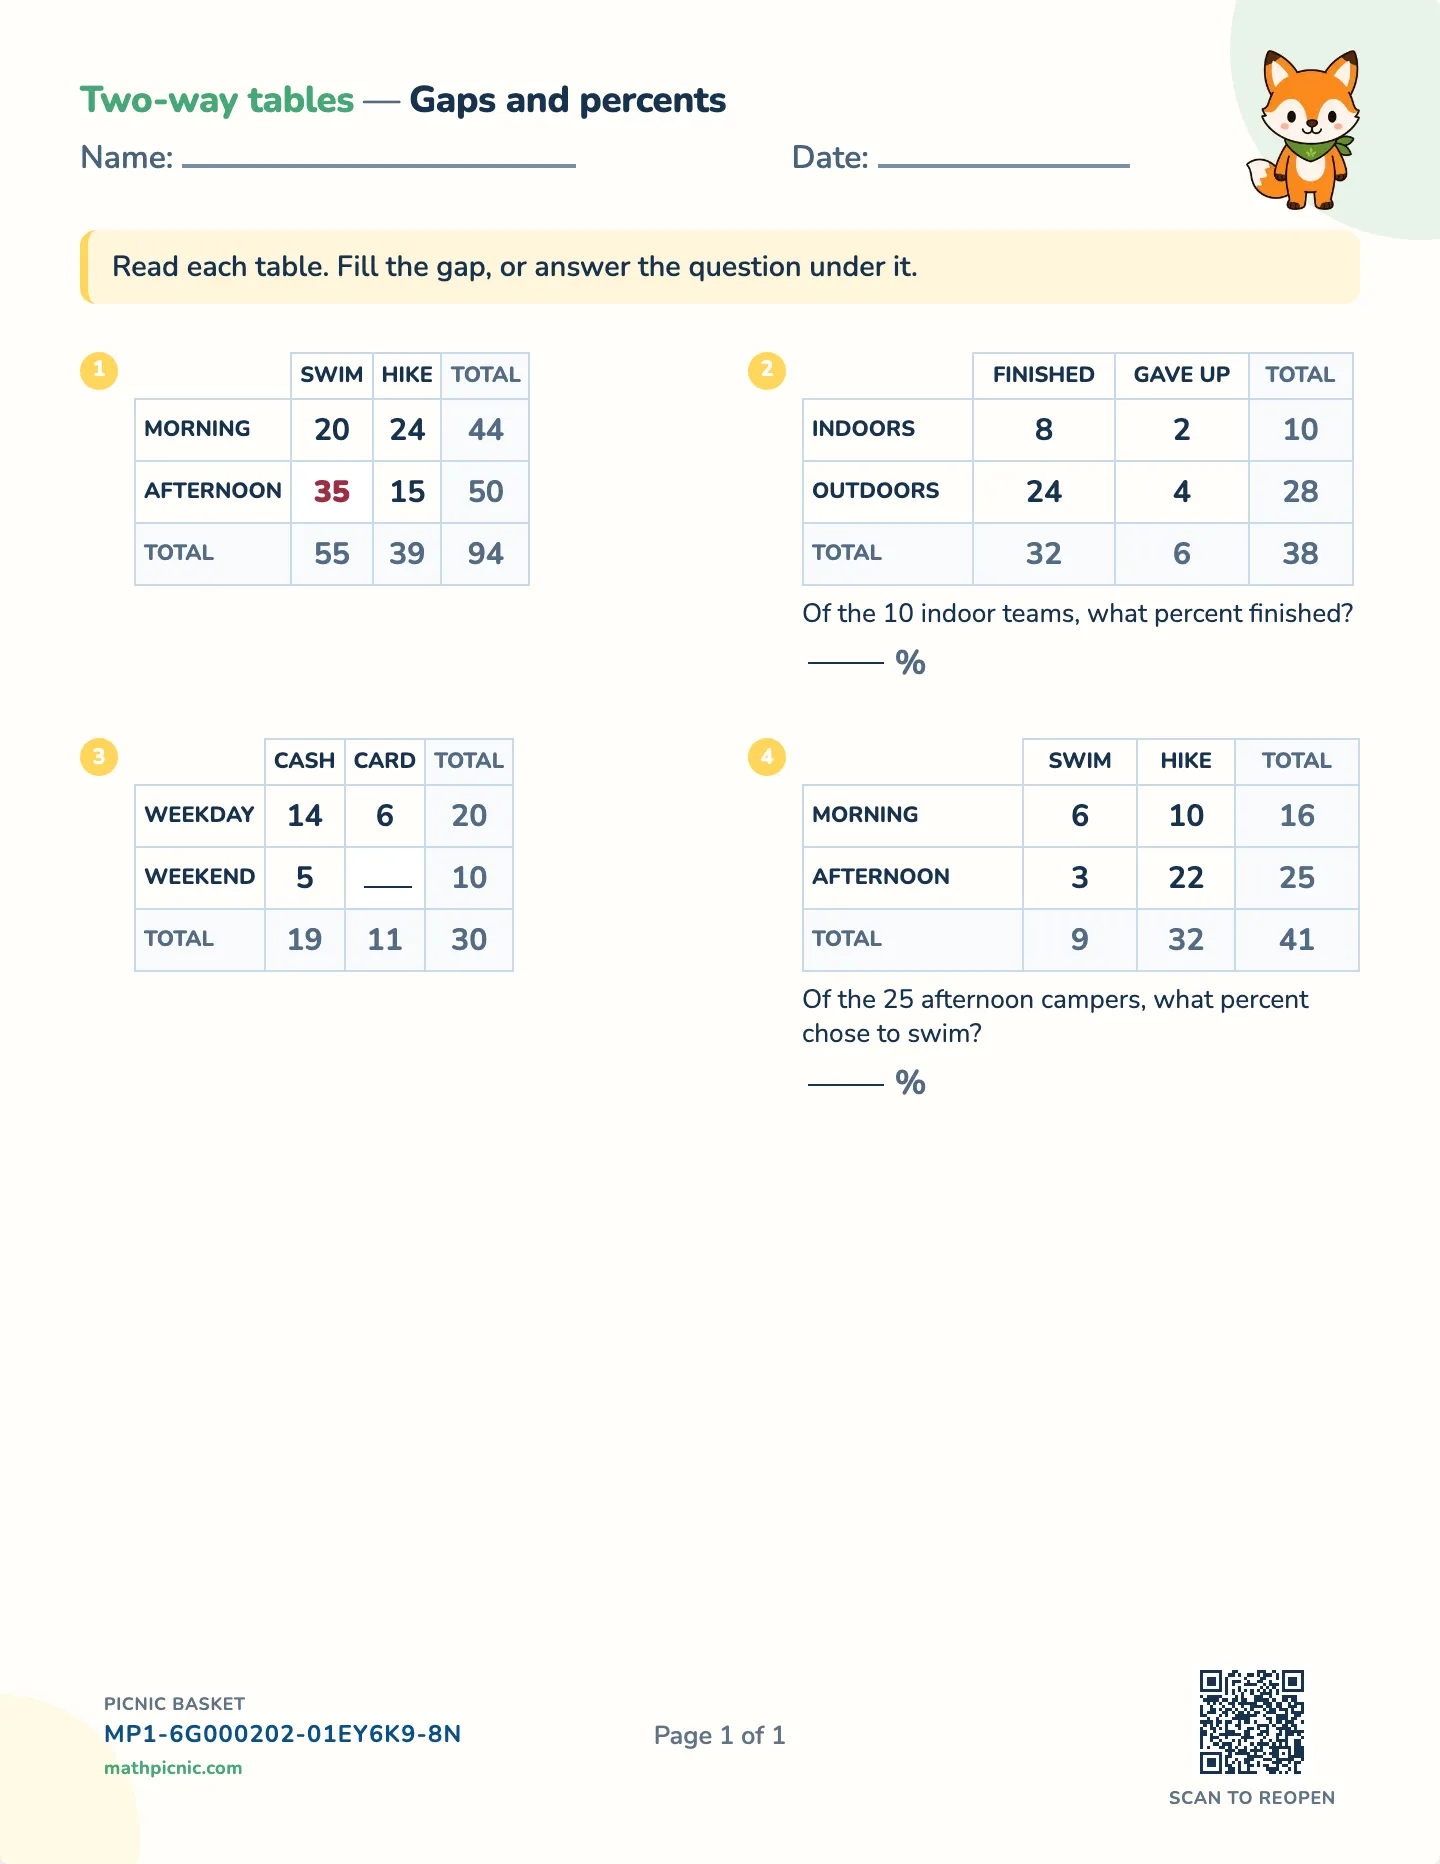
Two categories across, two down, and the margins that hold them together. These free printable worksheets fill the gaps and find the relative frequencies.
A two-way table sorts the same group of people two ways at once — which grade they are in AND whether they have a pet — and the whole of reading one is knowing that every number belongs to a row and to a column at the same time. The margins are not decoration: they are the totals those rows and columns add up to, and they are what makes a gap findable.
Why this sheet works
So the first setting blanks one number and prints all the totals. It is a subtraction, and the arithmetic is not the point — knowing which row and which column the gap sits in is. There are two ways to it, along the row and down the column, and they have to agree; a student who checks one against the other has understood the structure rather than followed an instruction.
How this one works
One question from a sheet like this one, worked a step at a time — with a sentence saying what just happened and why.
Read each table. Fill the gap, or answer the question under it.
1
Swim
Hike
Total
Morning
20
24
44
Afternoon
15
50
Total
55
39
94
2
Finished
Gave up
Total
Indoors
8
2
10
Outdoors
24
4
28
Total
32
6
38
Of the 10 indoor teams, what percent finished?
%
3
Cash
Card
Total
Weekday
14
6
20
Weekend
5
10
Total
19
11
30
4
Swim
Hike
Total
Morning
6
10
16
Afternoon
3
22
25
Total
9
32
41
Of the 25 afternoon campers, what percent chose to swim?
%
Two-way tables · Gaps and percentsAnswer key
1. Afternoon and Swim = 352. Of the 10 indoor teams, what percent finished? 80%3. Weekend and Card = 54. Of the 25 afternoon campers, what percent chose to swim? 12%