Histograms worksheets

A histogram groups the data before drawing it, so a bar stands for a range rather than for one value. These free printable worksheets ask how many fall in an interval, how many there are altogether, and which interval holds the most.

Kid stuck on one? You don’t just get the sheet.

Histograms
Histograms worksheet — Five intervals, free printable with answer key

The answer key prints on a separate page.

What's on this sheet

The difference from a bar graph is the axis. Bar-graph categories are separate things — dogs, cats, fish — and their order means nothing; histogram intervals are consecutive stretches of one measurement, which is why the bars touch. A child who has only met bar graphs will read a histogram correctly and still not know why it looks different.

Why this sheet works

Adding the bars gives the total number measured, and that question appears on every chart because it is the one that proves the intervals were understood. Anyone who reads a bar as "one child" rather than "eight children in this range" gets a total that gives itself away.

How this one works

One question from this sheet, worked through a step at a time.

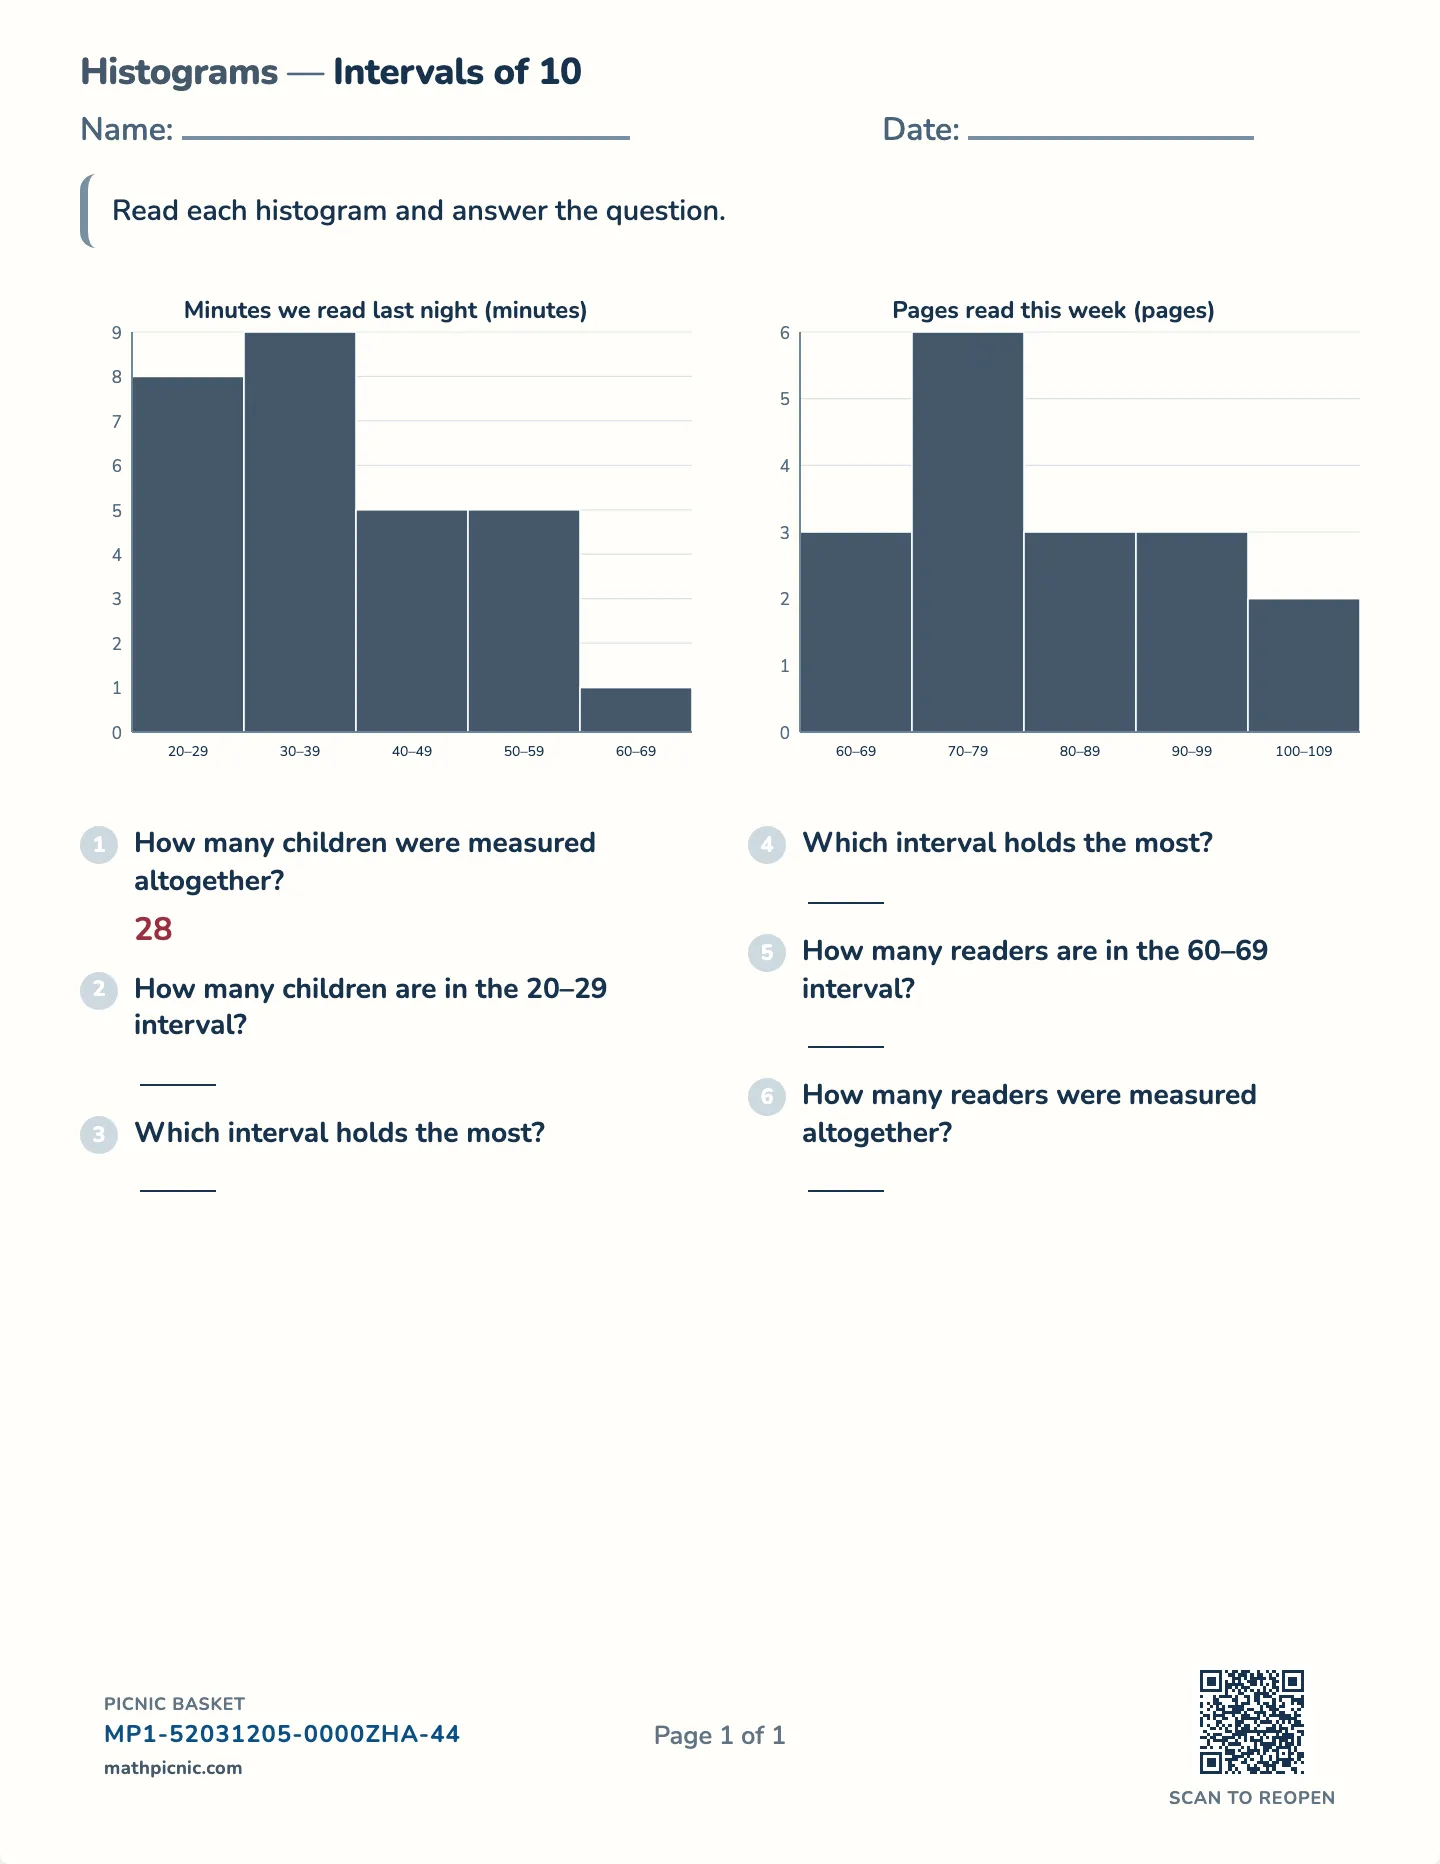
Minutes we read last night (minutes)

bands:20–2930–3940–4950–5960–69
20–29:8 children
30–39:9 children
40–49:5 children
50–59:5 children
60–69:1 children
20–29:8 children
30–39:9 children
40–49:5 children
50–59:5 children
60–69:1 children
28
  1. The bars touch, and that is the clue: this is not a bar graph of separate things, it is a number line cut into stretches of 10 minutes. Each bar is a BAND, not a value.
  2. So a bar's height counts how many fell ANYWHERE inside its band — the 20–29 bar says 8 children, but not what any single one of them was.
  3. 8 + 9 + 5 + 5 + 1 = 28 — so the answer is 28.