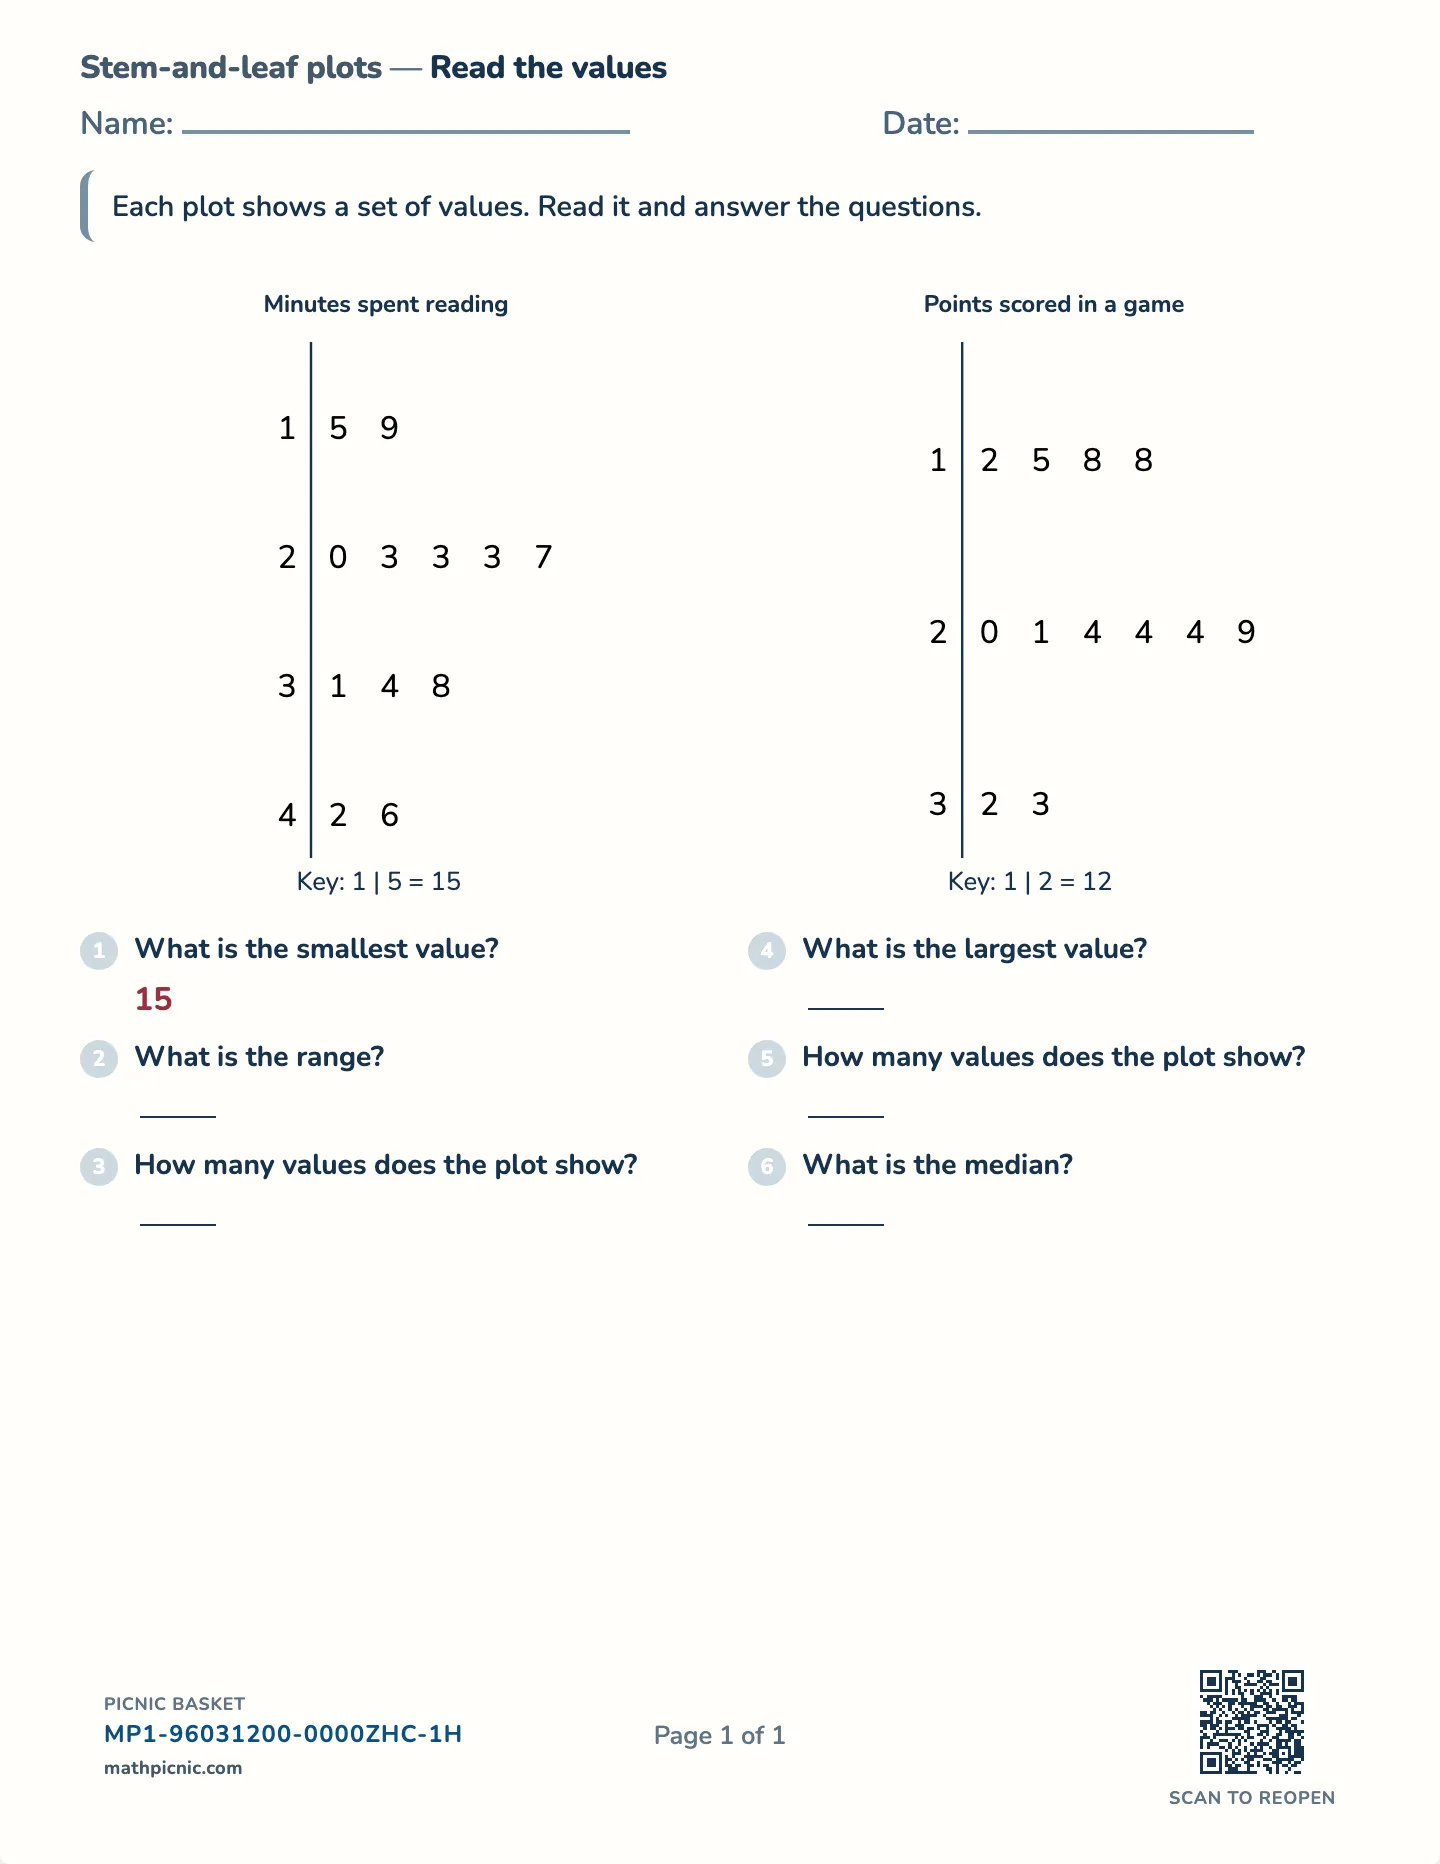
Stem-and-leaf plots worksheets

A stem-and-leaf plot is a list of numbers stood on its side: the tens down the left, the ones along each row. These free printable worksheets ask for values read back off the plot — the largest, the smallest, the one in the middle.

Kid stuck on one? You don’t just get the sheet.

Stem-and-leaf plots
Stem-and-leaf plots worksheet — Values kept in full, free printable with answer key

The answer key prints on a separate page.

What's on this sheet

It is the one display that keeps every original value. A stem of 3 with leaves 1, 2 and 5 means 31, 32 and 35, all still there and all still readable, which is what a histogram gives up when it groups. Reading a row back out loud is usually enough for the idea to land.

Why this sheet works

Because the leaves are written in order, the plot sorts the data for free — and that is what makes the median easy. Counting in from both ends of an already-ordered list is a much smaller job than sorting fifteen numbers first, and it is worth pointing out that the display did the hard part.

How this one works

One question from this sheet, worked through a step at a time.

What is the smallest value?

1 | 5=15
15, 19, 20, 23, 23, 23, 27, 31, 34, 38, 42, 46
15
15
  1. Read the key before the data. Each leaf is a single DIGIT stuck onto its stem, so the 1 row with a 5 on it means 15 — not 1 and not 5. The row is a list of values, not a bar.
  2. That means the plot has kept every value, and kept them in order: 15, 19, 20, 23, 23, 23, 27, 31, 34, 38, 42, 46. Nothing has been rounded away and nothing has been grouped, which is what makes questions like this one answerable at all.
  3. The leaves in each row are written in order and the rows climb, so the smallest value is the very first leaf of the top row: 15.
  4. So the answer is 15 minutes.