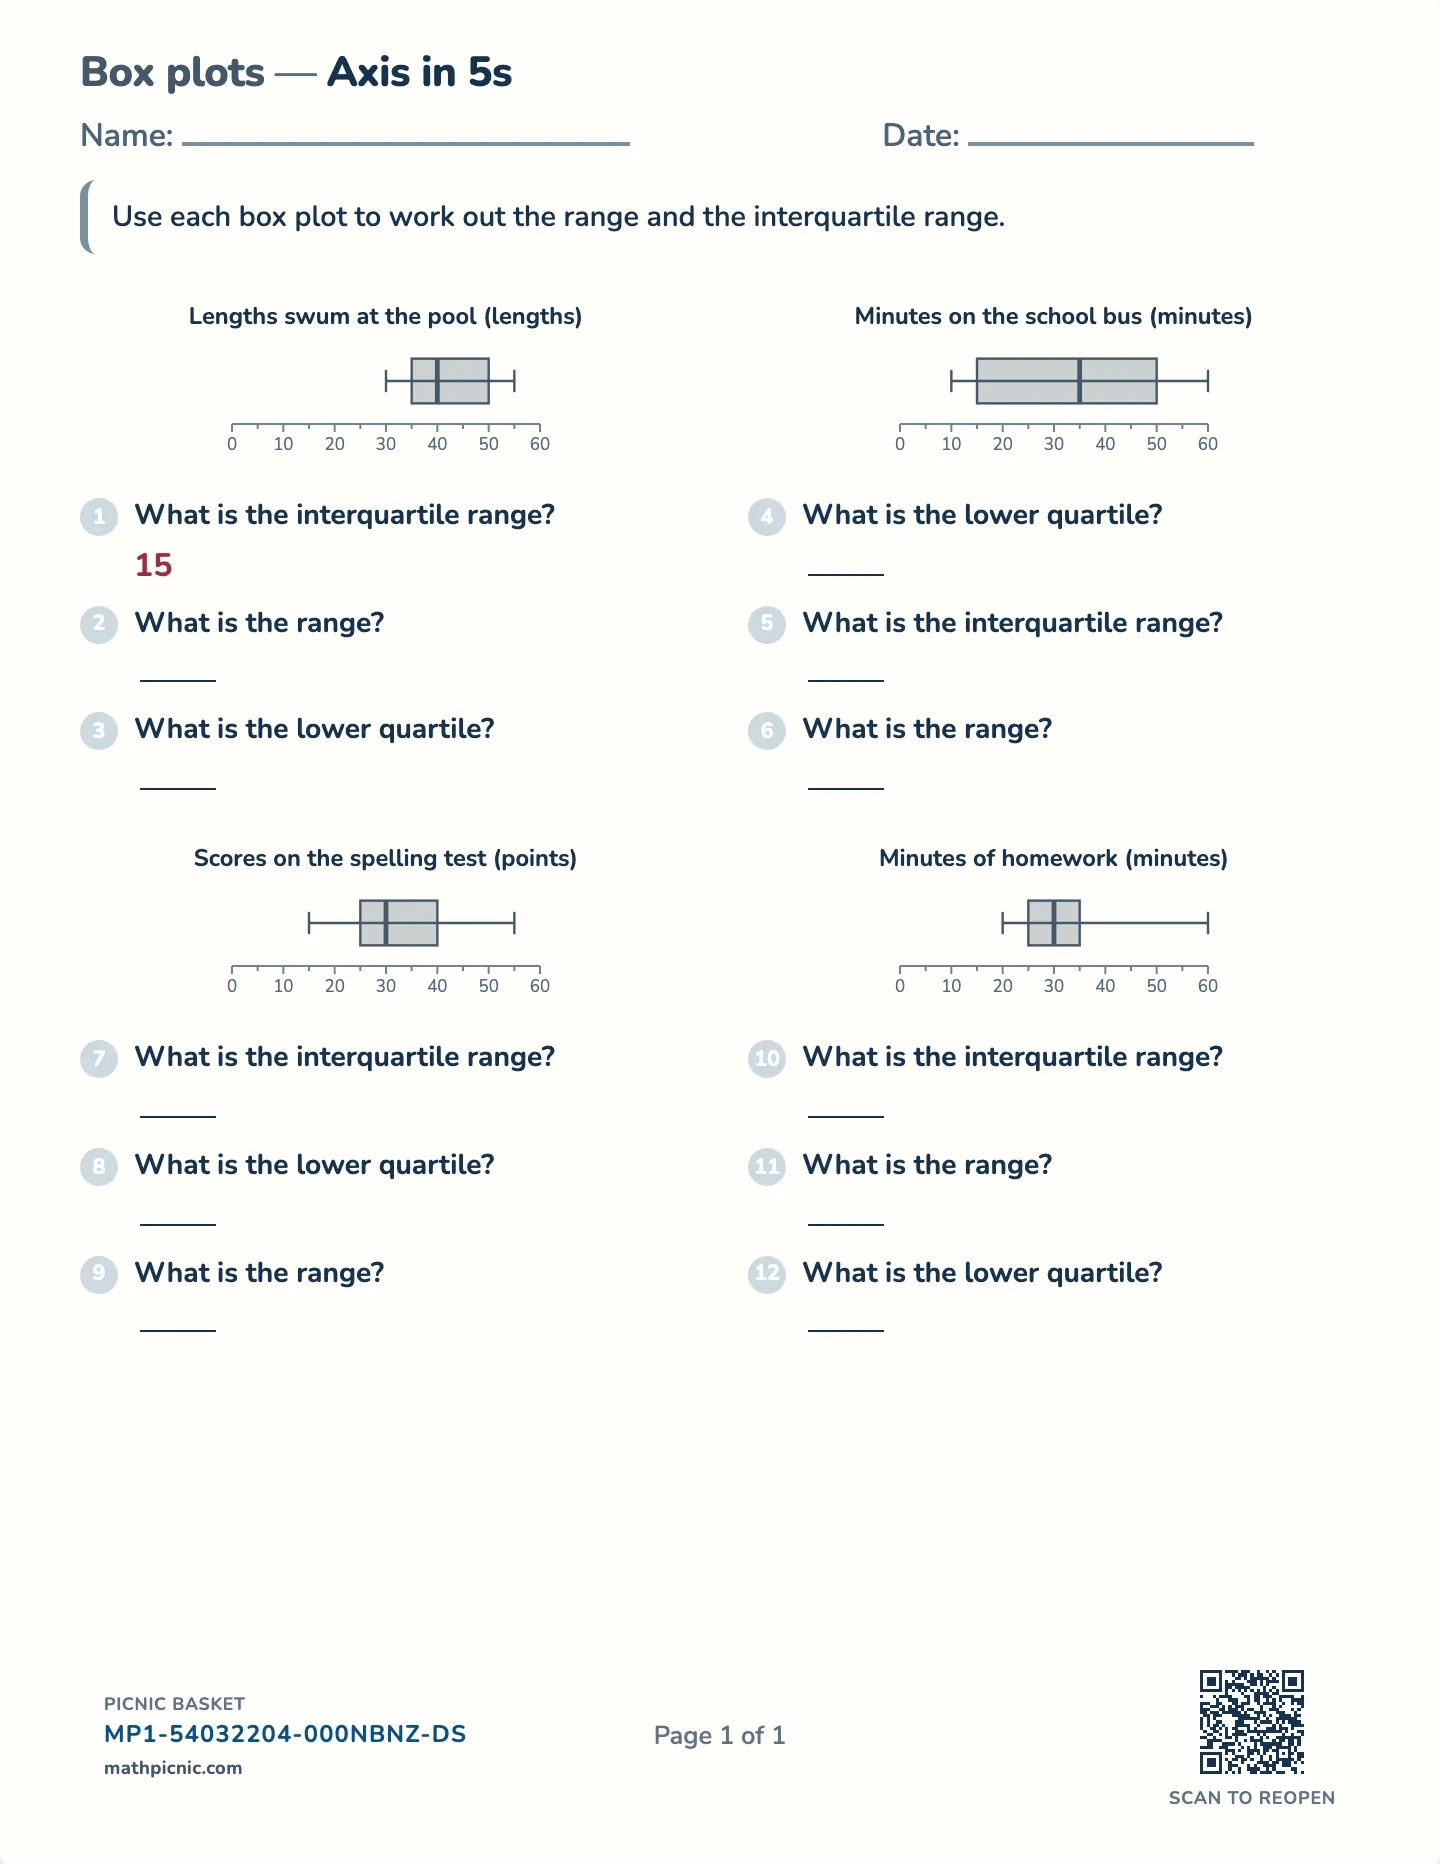
Box plot range and IQR worksheets

Two spreads live in a box plot: the range across the whole diagram and the interquartile range across the box. These free printable worksheets read the marks and subtract for each, with an answer key.

Kid stuck on one? You don’t just get the sheet.

Box plot range and IQR
Box plot range and IQR worksheet — Range and IQR from the diagram, free printable with answer key

The answer key prints on a separate page.

What's on this sheet

The range is the distance from the left whisker end to the right — the largest value minus the smallest — and it uses only the two extremes. The interquartile range is the width of the box, Q3 minus Q1, and it describes the middle half where most of the data actually sits. Reading both off the same picture is what makes the difference between them concrete.

Why this sheet works

This is the box-plot twin of the interquartile-range sheet, and the difference is where the numbers come from. There, a child orders a list to find the quartiles; here the quartiles are already drawn and the work is reading them off and subtracting. The box being the middle half is the idea worth holding: a wide box means the central values are spread, a narrow one means they are packed together, whatever the whiskers do.

How this one works

One question from this sheet, worked through a step at a time.

Lengths swum at the pool (lengths)

left whisker end:30 lengths
left edge of the box:35 lengths
left whisker end:30 lengths
left edge of the box:35 lengths
line inside the box:40 lengths
left whisker end:30 lengths
left edge of the box:35 lengths
line inside the box:40 lengths
right edge of the box:50 lengths
left whisker end:30 lengths
left edge of the box:35 lengths
line inside the box:40 lengths
right edge of the box:50 lengths
right whisker end:55 lengths
left whisker end:30 lengths
left edge of the box:35 lengths
line inside the box:40 lengths
right edge of the box:50 lengths
right whisker end:55 lengths
left whisker end:30 lengths
left edge of the box:35 lengths
line inside the box:40 lengths
right edge of the box:50 lengths
right whisker end:55 lengths
15 lengths
  1. A box plot is five numbers drawn to scale — not a bar, and nothing here is a total. Read the five marks off one at a time, and the question answers itself.
  2. Left whisker end: 30 lengths — the smallest value.
  3. Left edge of the box: 35 lengths — the quarter mark — a quarter of the data is below it.
  4. Line inside the box: 40 lengths — the MEDIAN, not the mean and not the middle of the box's width.
  5. Right edge of the box: 50 lengths — the three-quarter mark.
  6. Right whisker end: 55 lengths — the largest value.
  7. Now the question, and this one is a subtraction between two of the marks: the width of the box: 50 − 35 = 15
  8. So the answer is 15 lengths. Nothing is added or averaged — a box plot is read, not calculated.