Reading box plots worksheets

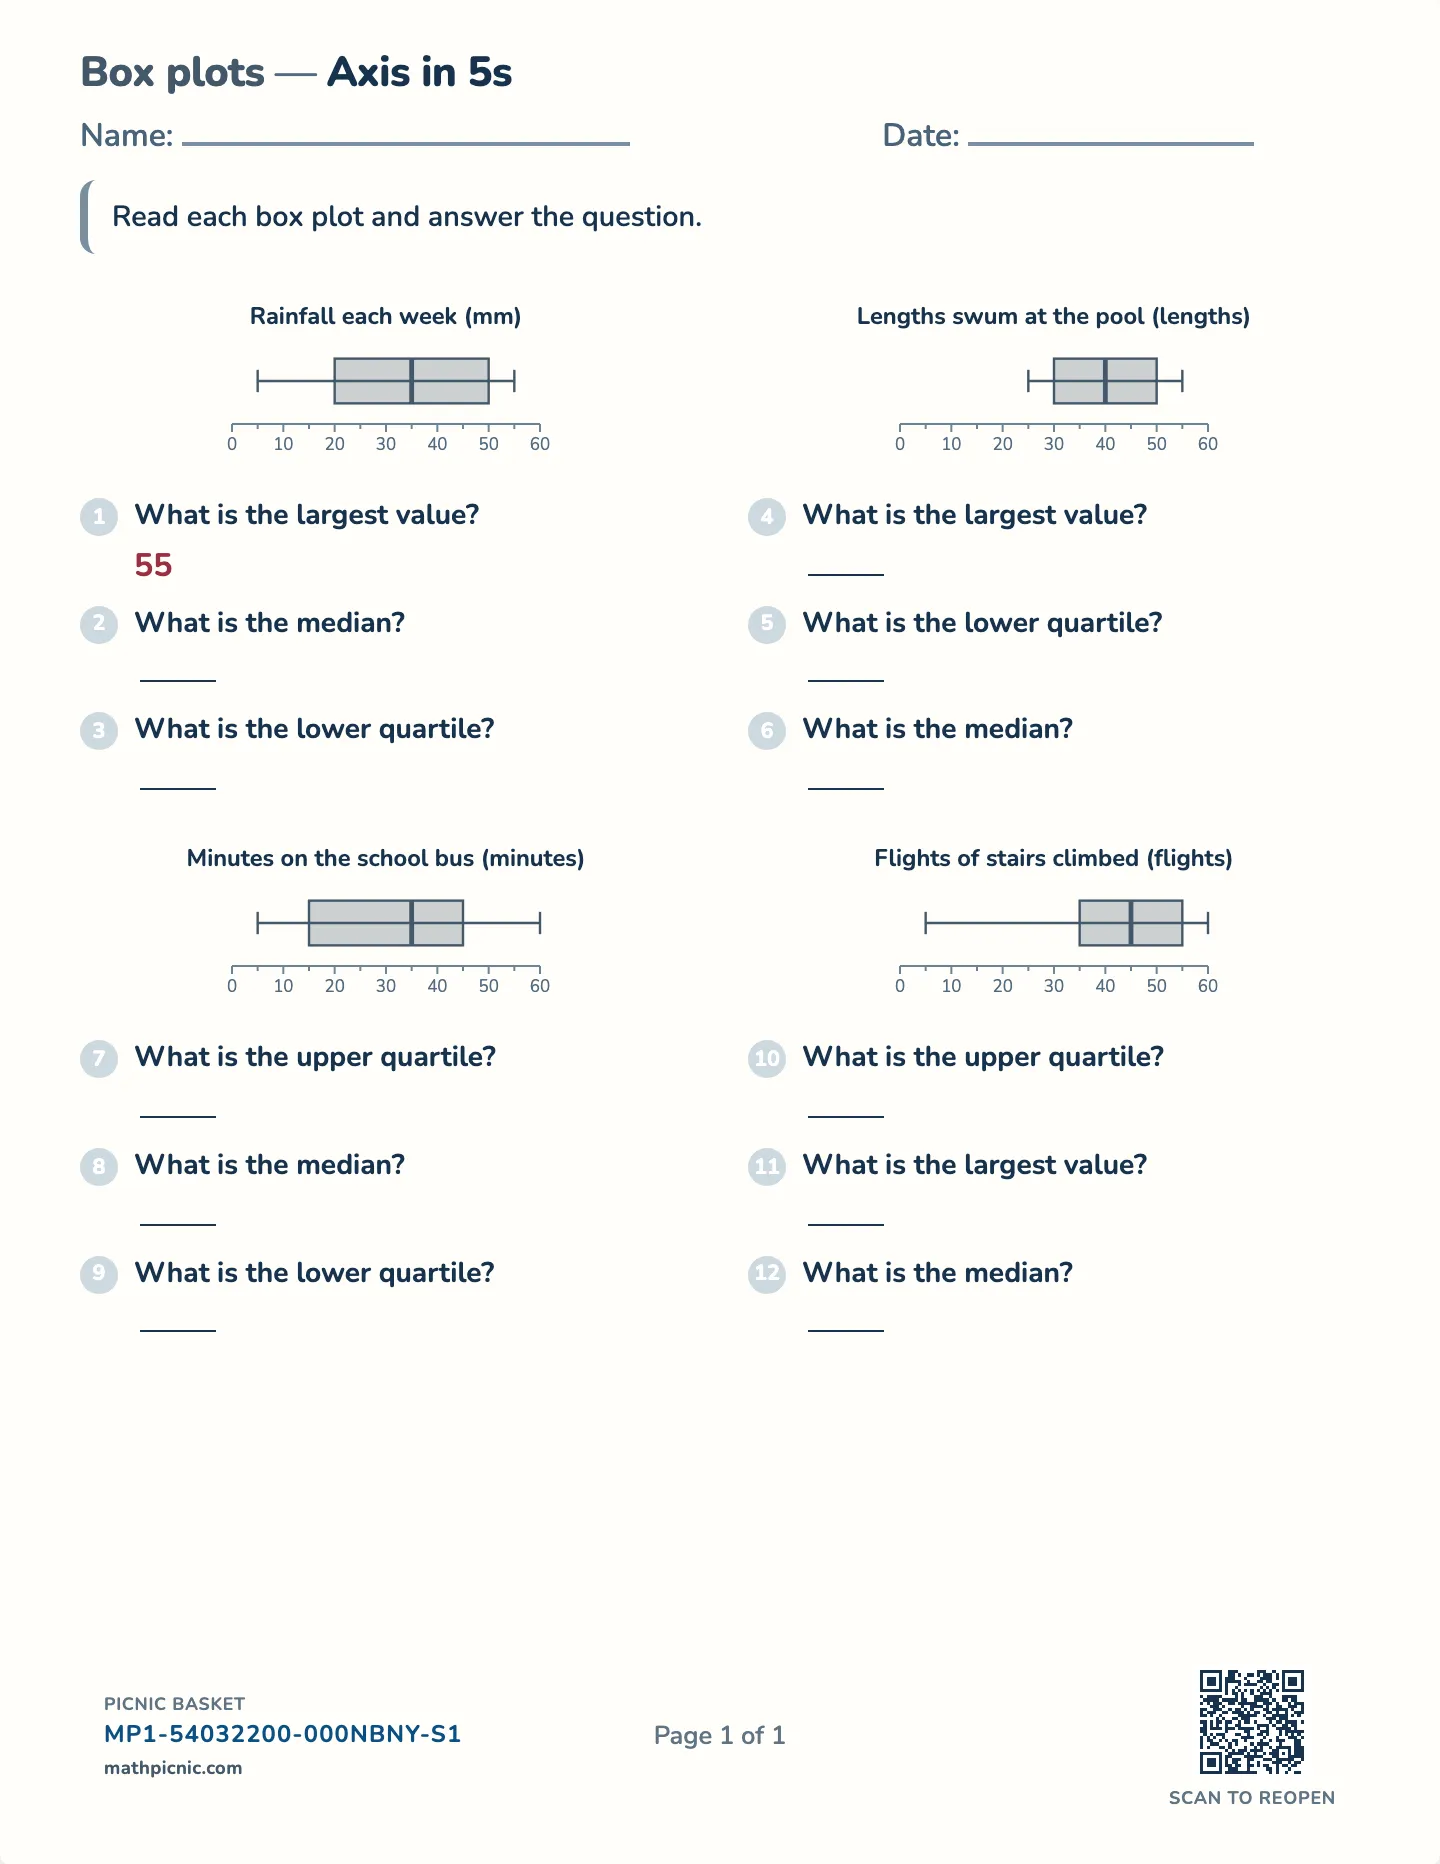
A box plot says exactly five things about a set of numbers, and reading one is knowing which five. These free printable worksheets ask for each mark off a drawn diagram — the smallest, the quartiles, the median, and the largest.

Kid stuck on one? You don’t just get the sheet.

Reading box plots
Reading box plots worksheet — Five-number summary, free printable with answer key

The answer key prints on a separate page.

What's on this sheet

The five-number summary splits the data into four equal parts, so each section of the plot holds a quarter of the values however wide or narrow it looks. That is the sentence to say out loud, because a long whisker looks like “most of them are up here” and means the opposite — the values there are spread out, not many.

Why this sheet works

The line inside the box is the median, and it is the mark children most often misread as the middle of the box rather than the middle of the data. Nothing here asks for a plot to be drawn: building one needs data to sort and a scale to choose, a classroom job, while reading one is the skill that transfers to every summary chart afterward. The marks are read as numbers, so the answer key can check them.

How this one works

One question from this sheet, worked through a step at a time.

Rainfall each week (mm)

left whisker end:5 mm
left edge of the box:20 mm
left whisker end:5 mm
left edge of the box:20 mm
line inside the box:35 mm
left whisker end:5 mm
left edge of the box:20 mm
line inside the box:35 mm
right edge of the box:50 mm
left whisker end:5 mm
left edge of the box:20 mm
line inside the box:35 mm
right edge of the box:50 mm
right whisker end:55 mm
left whisker end:5 mm
left edge of the box:20 mm
line inside the box:35 mm
right edge of the box:50 mm
right whisker end:55 mm
left whisker end:5 mm
left edge of the box:20 mm
line inside the box:35 mm
right edge of the box:50 mm
right whisker end:55 mm
55 mm
  1. A box plot is five numbers drawn to scale — not a bar, and nothing here is a total. Read the five marks off one at a time, and the question answers itself.
  2. Left whisker end: 5 mm — the smallest value.
  3. Left edge of the box: 20 mm — the quarter mark — a quarter of the data is below it.
  4. Line inside the box: 35 mm — the MEDIAN, not the mean and not the middle of the box's width.
  5. Right edge of the box: 50 mm — the three-quarter mark.
  6. Right whisker end: 55 mm — the largest value.
  7. Now the question. It is asking for the right whisker end, and that has already been read off — no arithmetic is owed.
  8. So the answer is 55 mm. Nothing is added or averaged — a box plot is read, not calculated.