Comparing two data sets worksheets

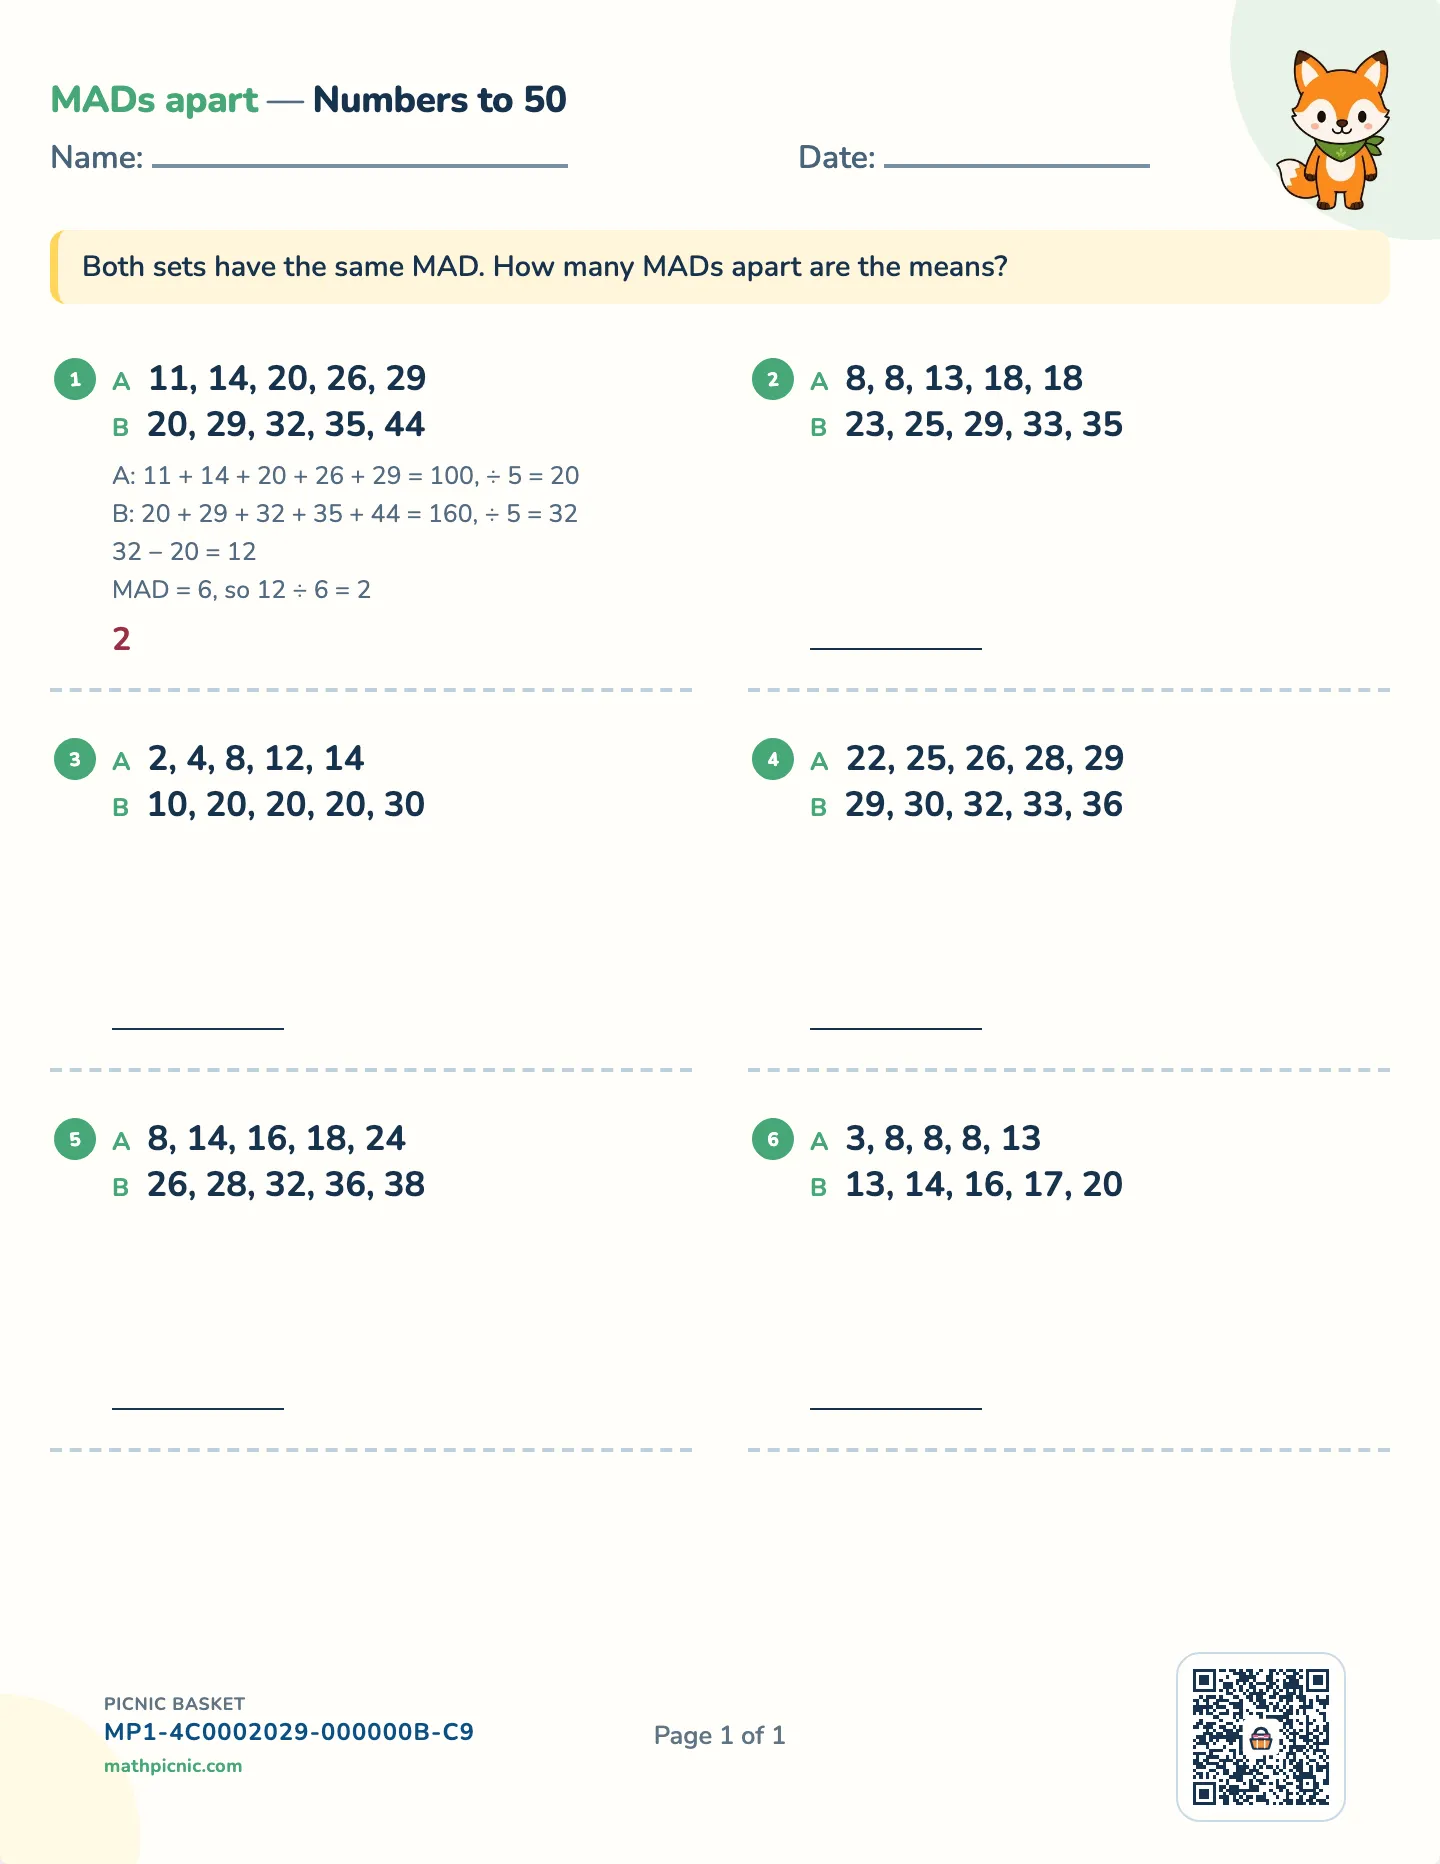
Two groups have means of 14 and 18. Is four a lot? Nothing about that number answers the question until you know how much the data varies anyway — and that is the whole of this sheet. These free printable worksheets ask for the gap between two centers measured in the sets' own spread.

Comparing two data sets
Comparing two data sets worksheet — Two sets of five, one shared MAD, free printable with answer key

The answer key prints on a separate page.

What's on this sheet

Every pair on these sheets has the same mean absolute deviation, and the sheet says so at the top. That is not a simplification, it is the condition the standard names: two distributions can only be compared this way when their variabilities are similar. With one shared MAD there is one unit to measure the gap in, and the answer is a whole number of them.

Why this sheet works

The work is three things and the answer key prints all three: the mean of A, the mean of B, and the difference divided by the MAD. A child who stops after the subtraction has done the arithmetic and not the comparison — the difference is a number about these two sets, and the multiple is a number you can carry to any other pair.

How this one works

How many MADs apart are the two means?

A:11 + 14 + 20 + 26 + 29 = 100, ÷ 5 =20
B:20 + 29 + 32 + 35 + 44 = 160, ÷ 5 =32
A:11 + 14 + 20 + 26 + 29 = 100, ÷ 5 =20
B:20 + 29 + 32 + 35 + 44 = 160, ÷ 5 =32
32 − 20 =12
32 − 20 =12
MAD = 6, so 12 ÷ 6 =2
  1. Find each set's mean first — that is the one number standing for where the set SITS. Start with A.
  2. Now B's mean, the same way.
  3. B sits 32 − 20 = 12 above A. On its own that number says nothing: 12 is a lot for data packed tightly together and very little for data spread wide.
  4. So measure the gap in the sets' OWN spread. Both have a MAD of 6, so the two means are 12 ÷ 6 = 2 MADs apart — the centres differ by 2 times as much as the values typically differ from their own centre.