
Circle graphsRead the shares
Name: Date:
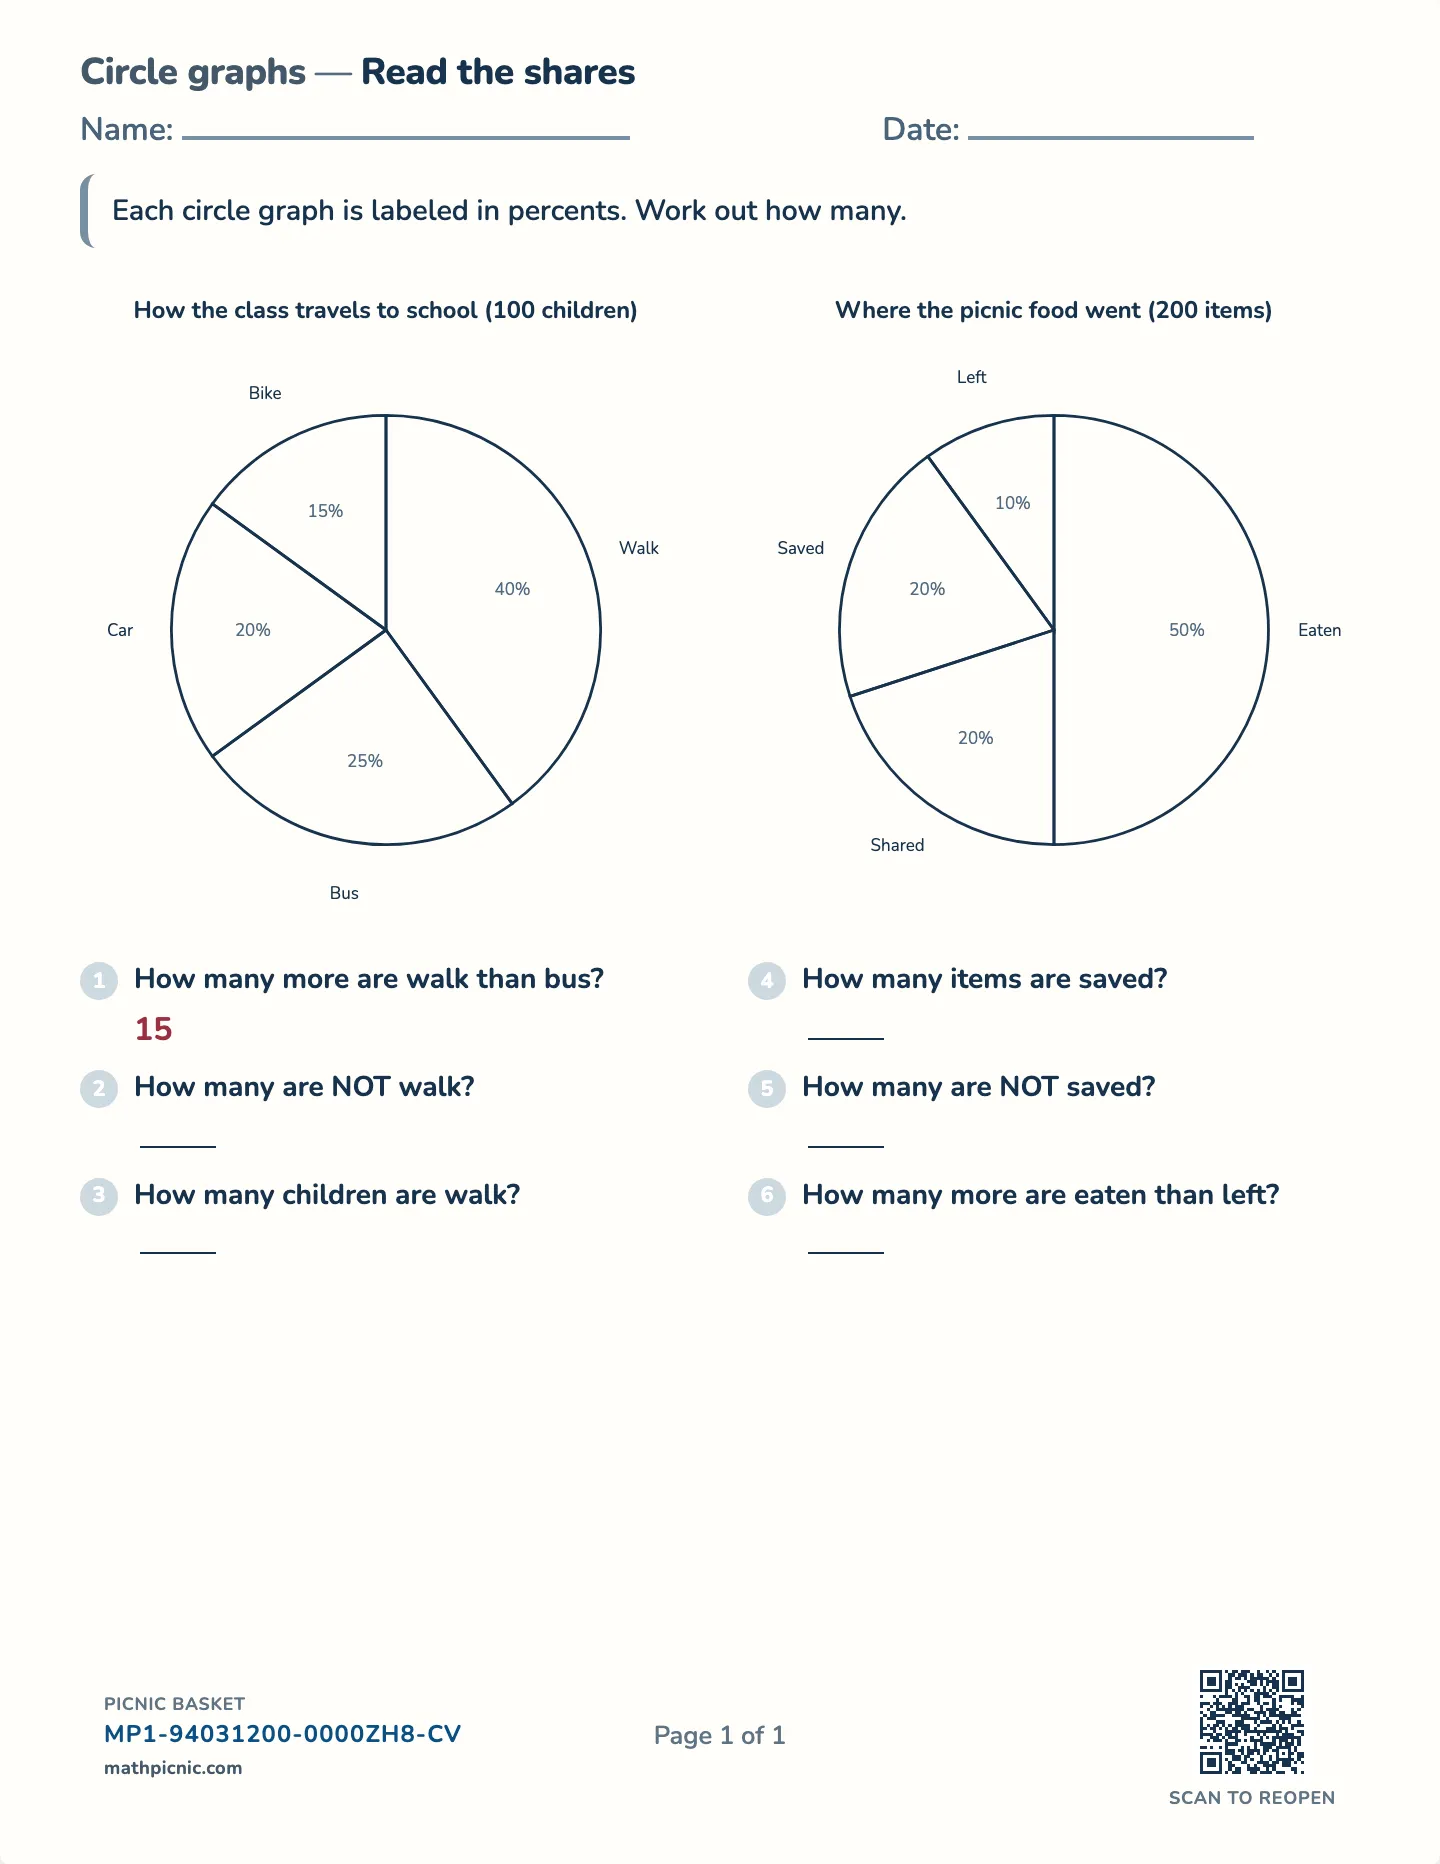
Each circle graph is labeled in percents. Work out how many.
1
How many more children walk to school than come by bus?
2
How many children do not walk to school?
3
How many children walk to school?
4
How many items were saved?
5
How many items were not saved?
6
How many more items were eaten than were left over?