The line of best fit worksheets

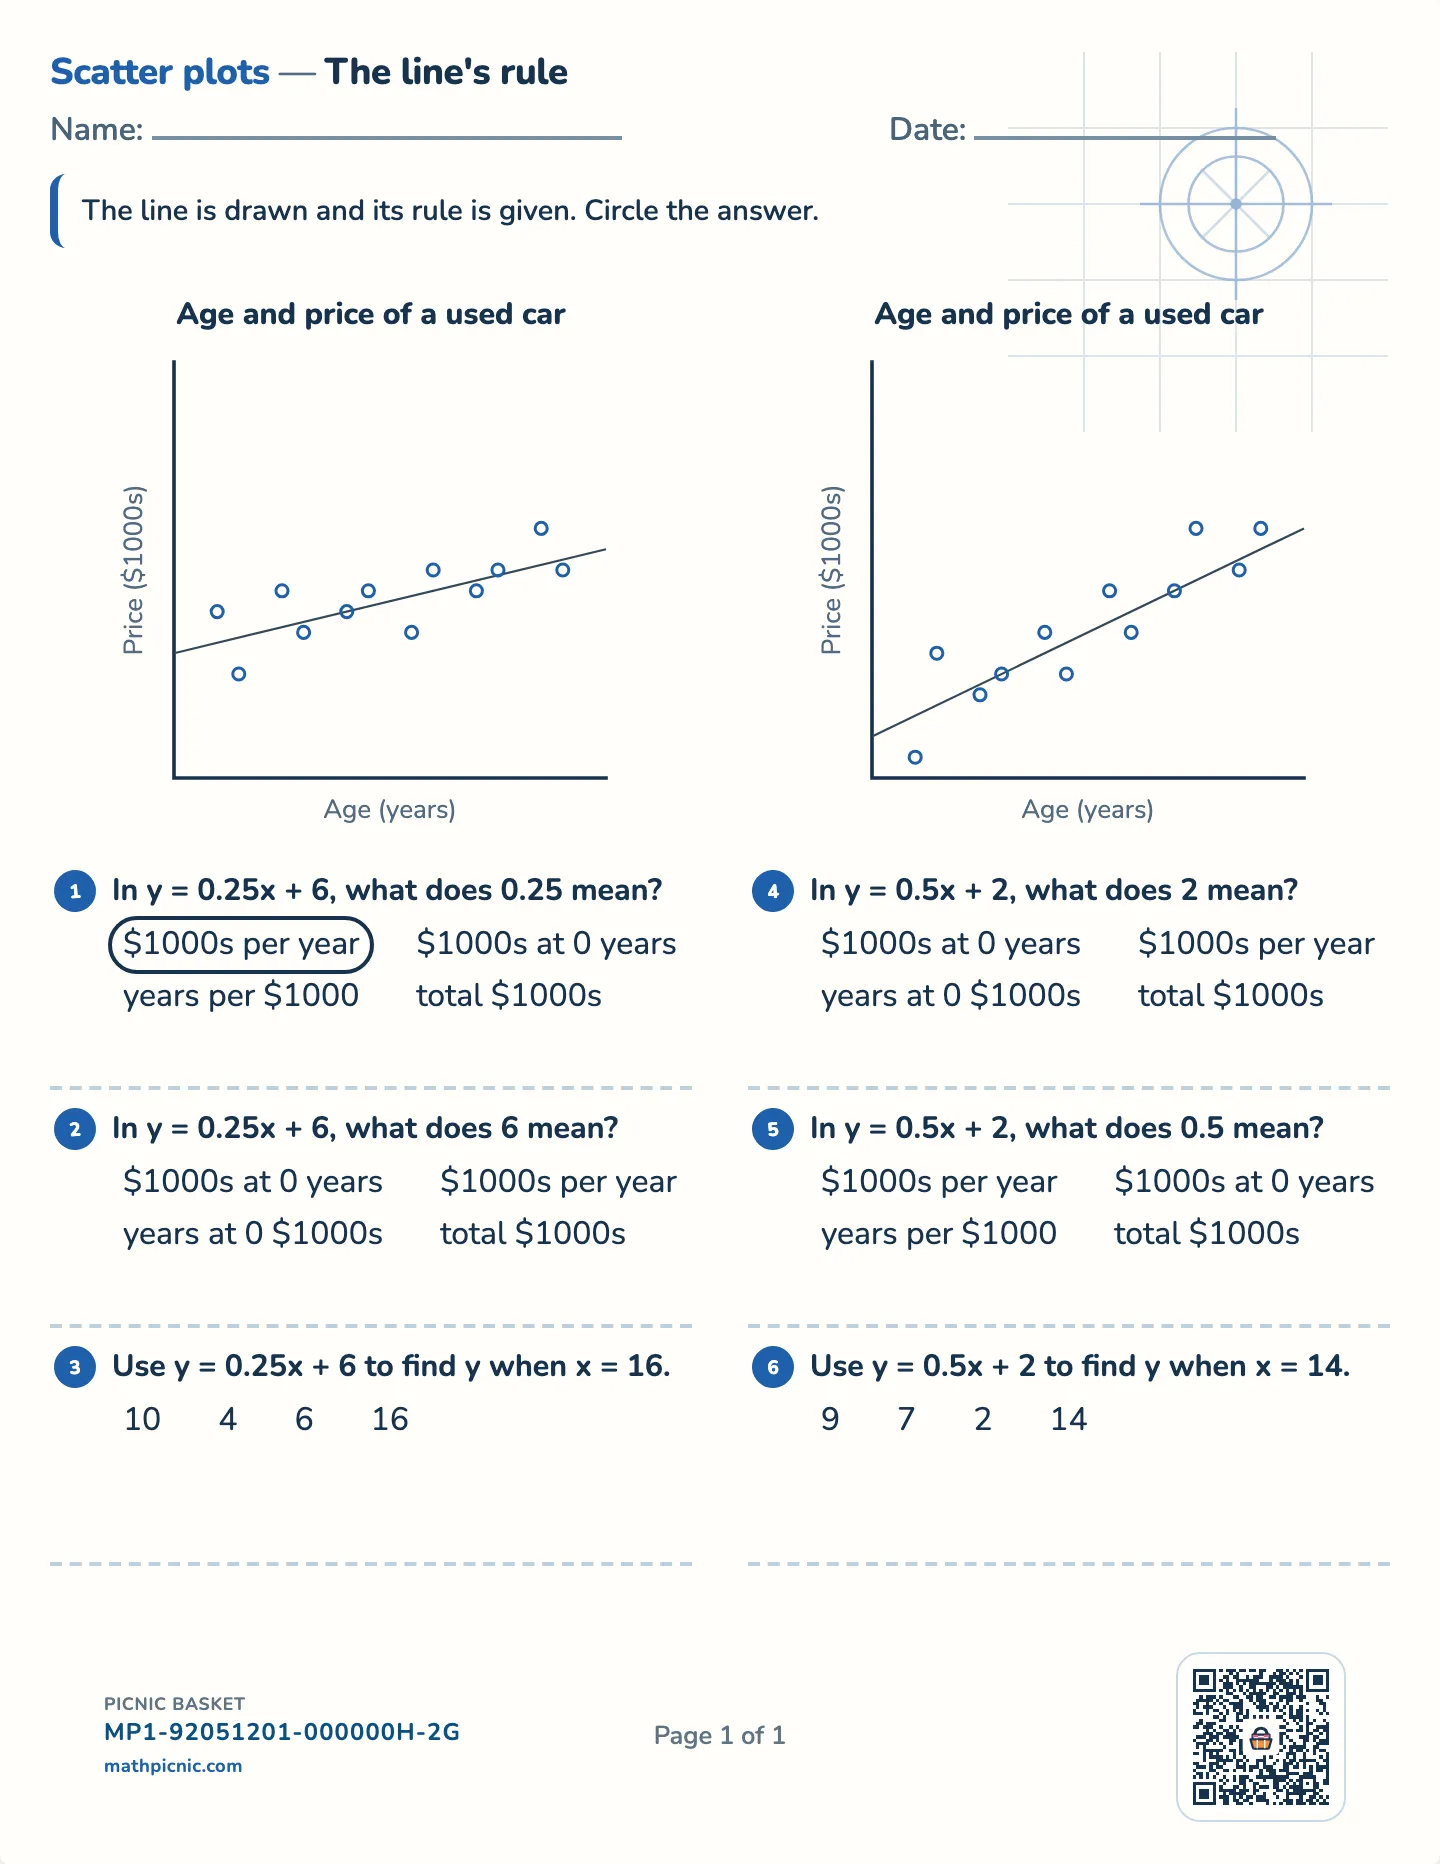
A line through a scatter plot is only useful once you can say what its two numbers mean. These free printable worksheets draw the line, print its rule, and ask what the 0.5 is, what the 2 is, and what the rule predicts.

The line of best fit
The line of best fit worksheet — The line drawn, its rule given, free printable with answer key

The answer key prints on a separate page.

What's on this sheet

The slope is a rate and the intercept is a starting value, and the commonest mistake is to swap them — so each question offers the other one as a wrong answer. "Points per hour" and "points at 0 hours" differ by three words and by the whole meaning of the model, and a page that never put them side by side would never find out which a student had.

Why this sheet works

The prediction is made from the rule, not read off the picture. The axes carry names and no numbers for exactly that reason: the standard says to USE the equation, and a numbered axis lets a student trace across instead. Every prediction comes out a whole number, so the arithmetic never obscures the reading.