Domain and rangeMixed, inequalities
Name: Date:
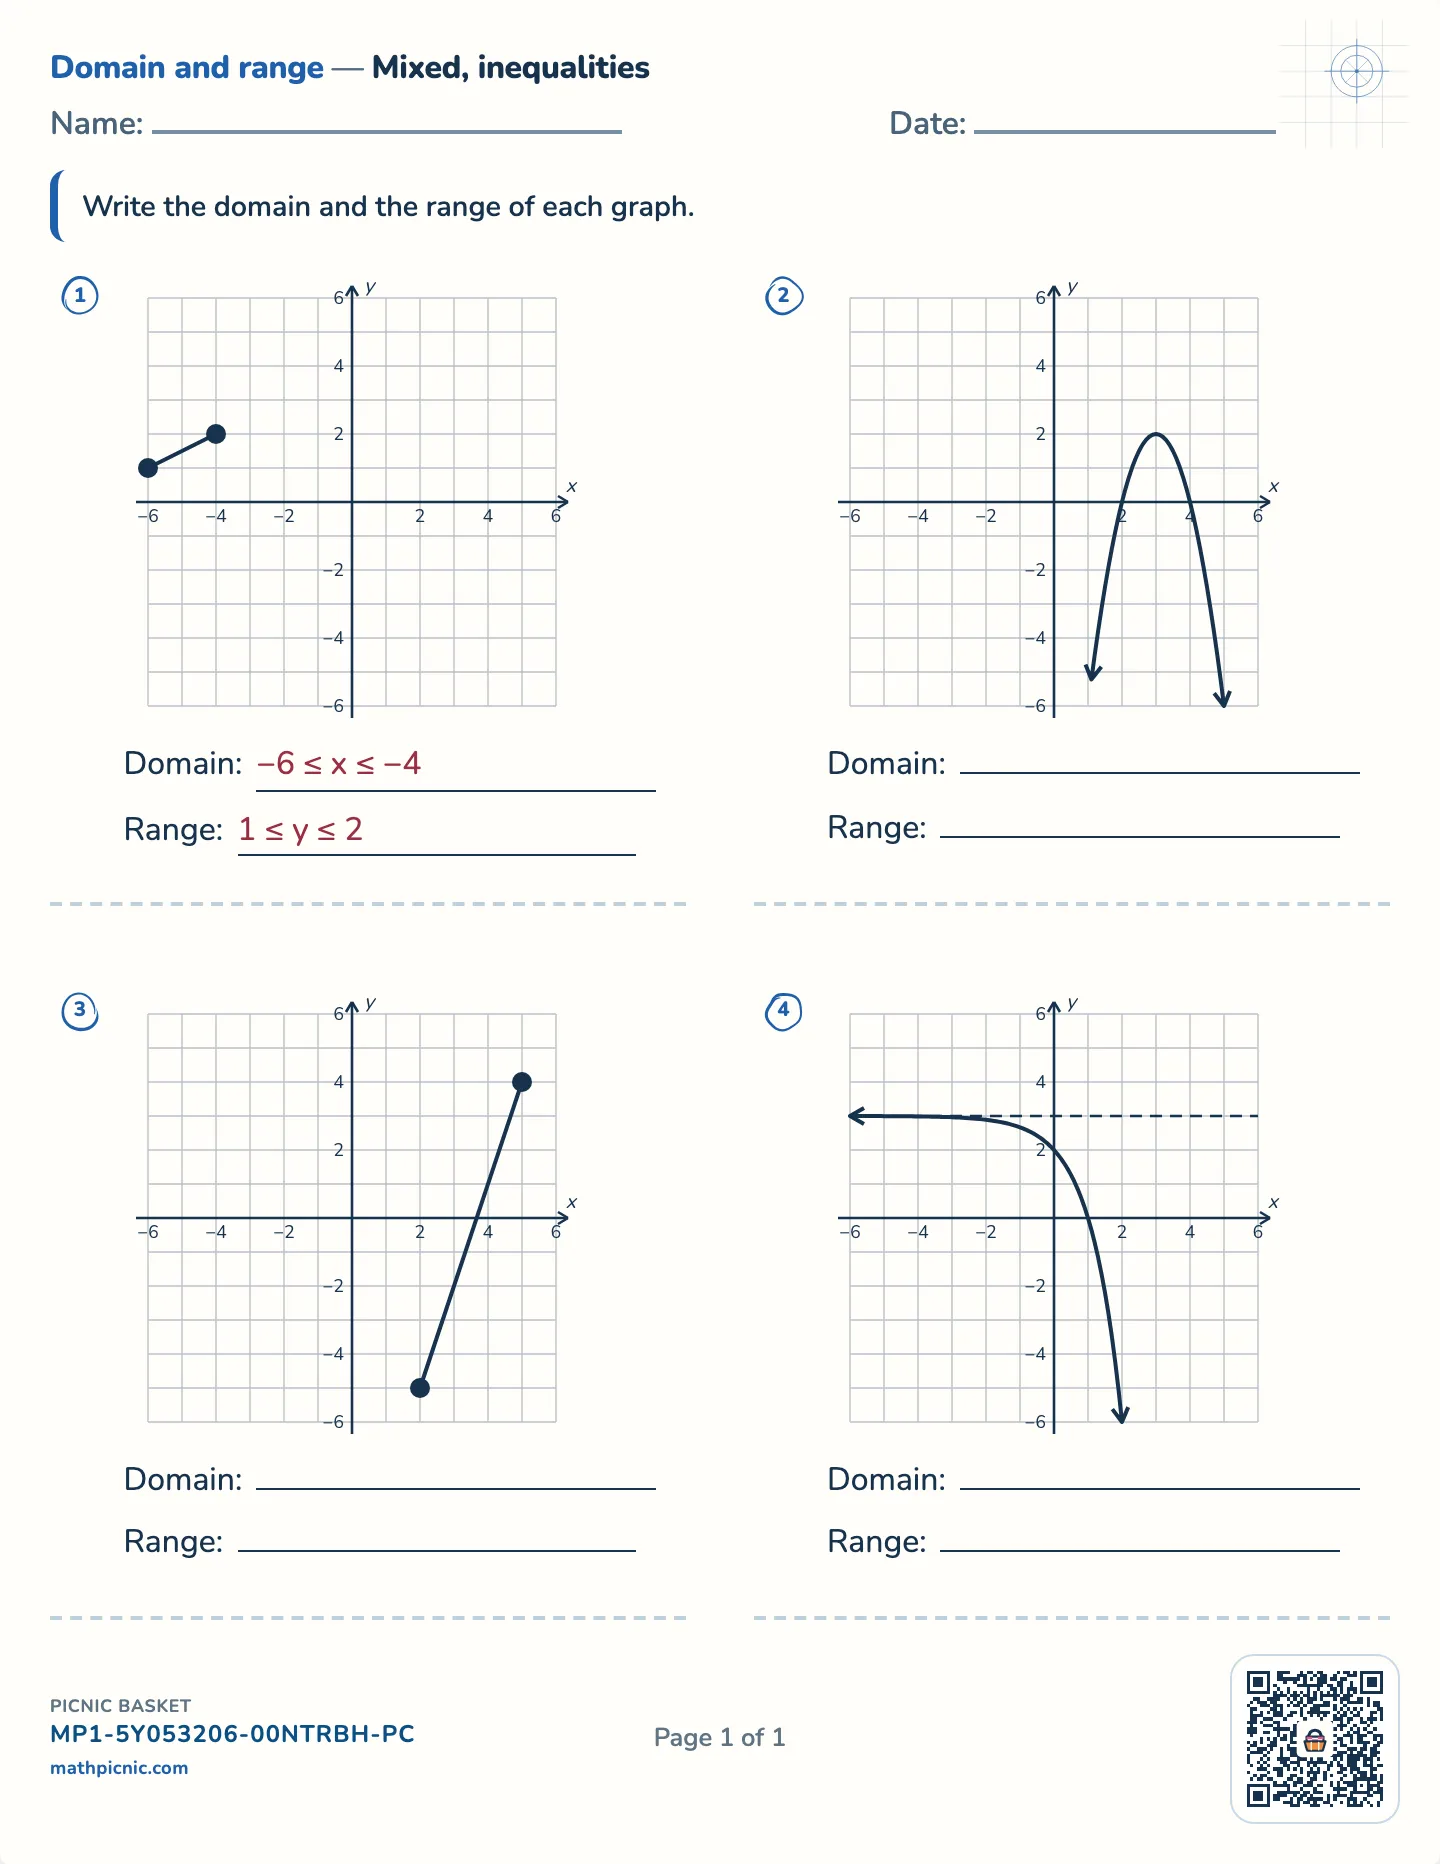
Write the domain and the range of each graph.
1Domain: Range:
2Domain: Range:
3Domain: Range:
4Domain: Range:

The domain is how far a graph runs from side to side, and the range is how far it runs up and down. These free printable worksheets read both off line segments, parabolas and exponential curves, with an answer sheet.
If they get stuck
The answer key prints on a separate page.
Read the domain left to right and the range bottom to top. On a segment that is two pairs of numbers, one for each end. A filled dot means the end is included and an open dot means it is not, and that decides whether the sign has a bar. A line that stops is a very different thing from a line with arrows.
A parabola with arrows runs on forever sideways, so its domain is all real numbers, but it does not reach every height. If it opens upward, its turning point is the lowest it ever gets, and the range starts there. An exponential is the subtle one. It gets ever closer to a line and never touches it, so that value is left out.
The line on the grid