Graph inequalities in two variablesGraph a system
Name: Date:
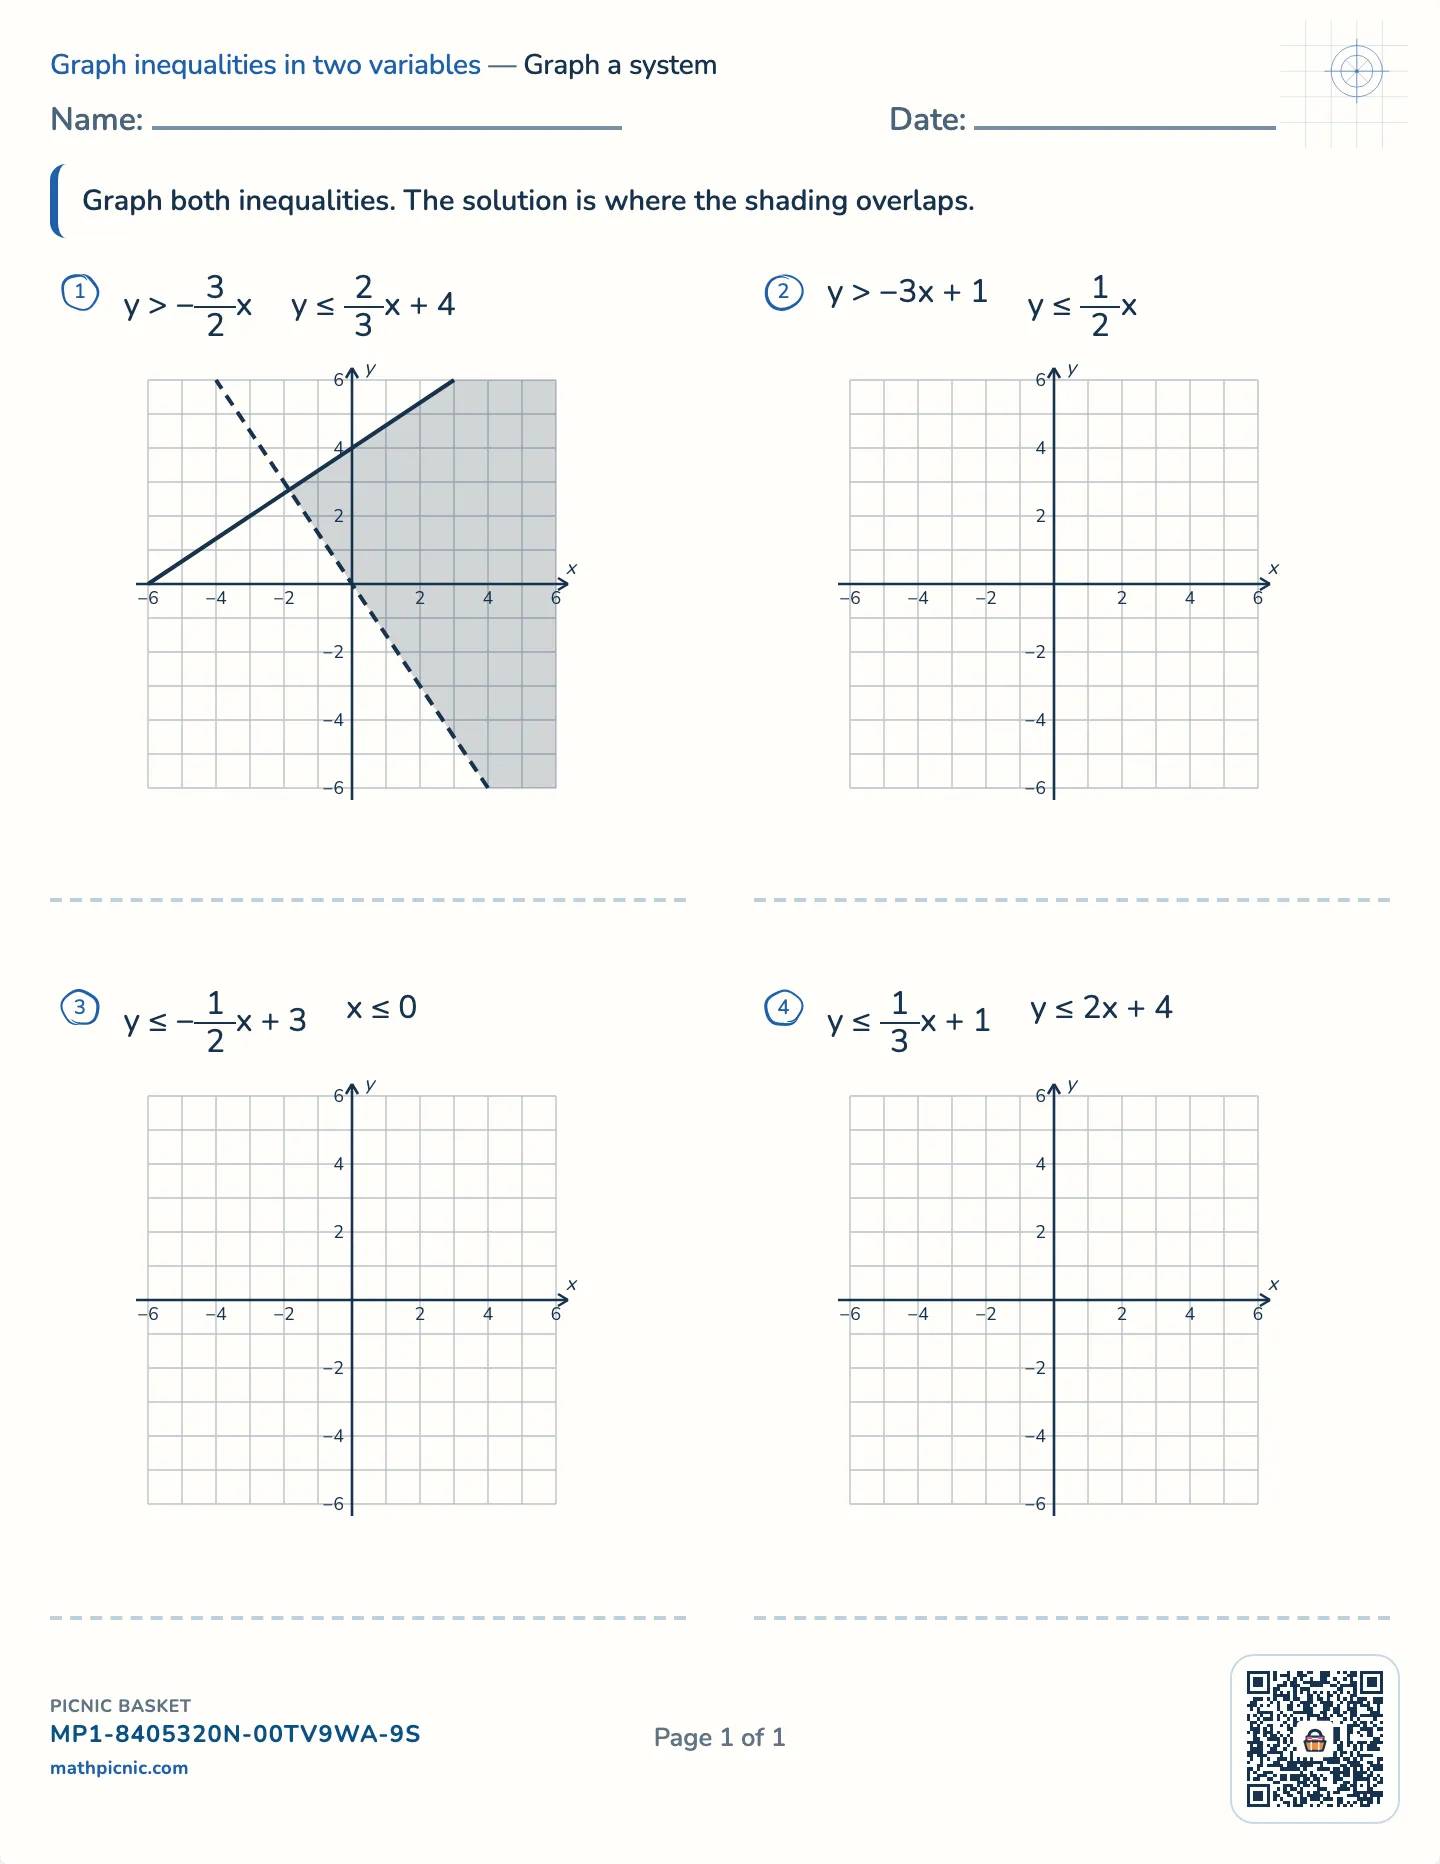
Graph both inequalities. The solution is where the shading overlaps.
1y > −32xy ≤ 23x + 4
2y > −3x + 1y ≤ 12x
3y ≤ −12x + 3x ≤ 0
4y ≤ 13x + 1y ≤ 2x + 4

A system of inequalities is two regions on one grid, and its solution is where they overlap. These free printable worksheets give pairs of inequalities and an empty grid for each pair, with an answer sheet that shows the result.
If they get stuck
The answer key prints on a separate page.
Each inequality is handled on its own, exactly as on a single-inequality sheet: decide solid or dashed, draw the line, test a point, and shade. Light shading in different directions makes the overlap easy to see, and a student who uses two colored pencils will find this page much tidier.
The solution is only the double-shaded part. A point in the region shaded once makes one statement true and the other false, so it is not a solution of the system. Choosing a point in the overlap and testing it in both inequalities is a good way to finish each question.
y > −x y ≤ x + 4