Graph inequalities in two variablesGraph one
Name: Date:
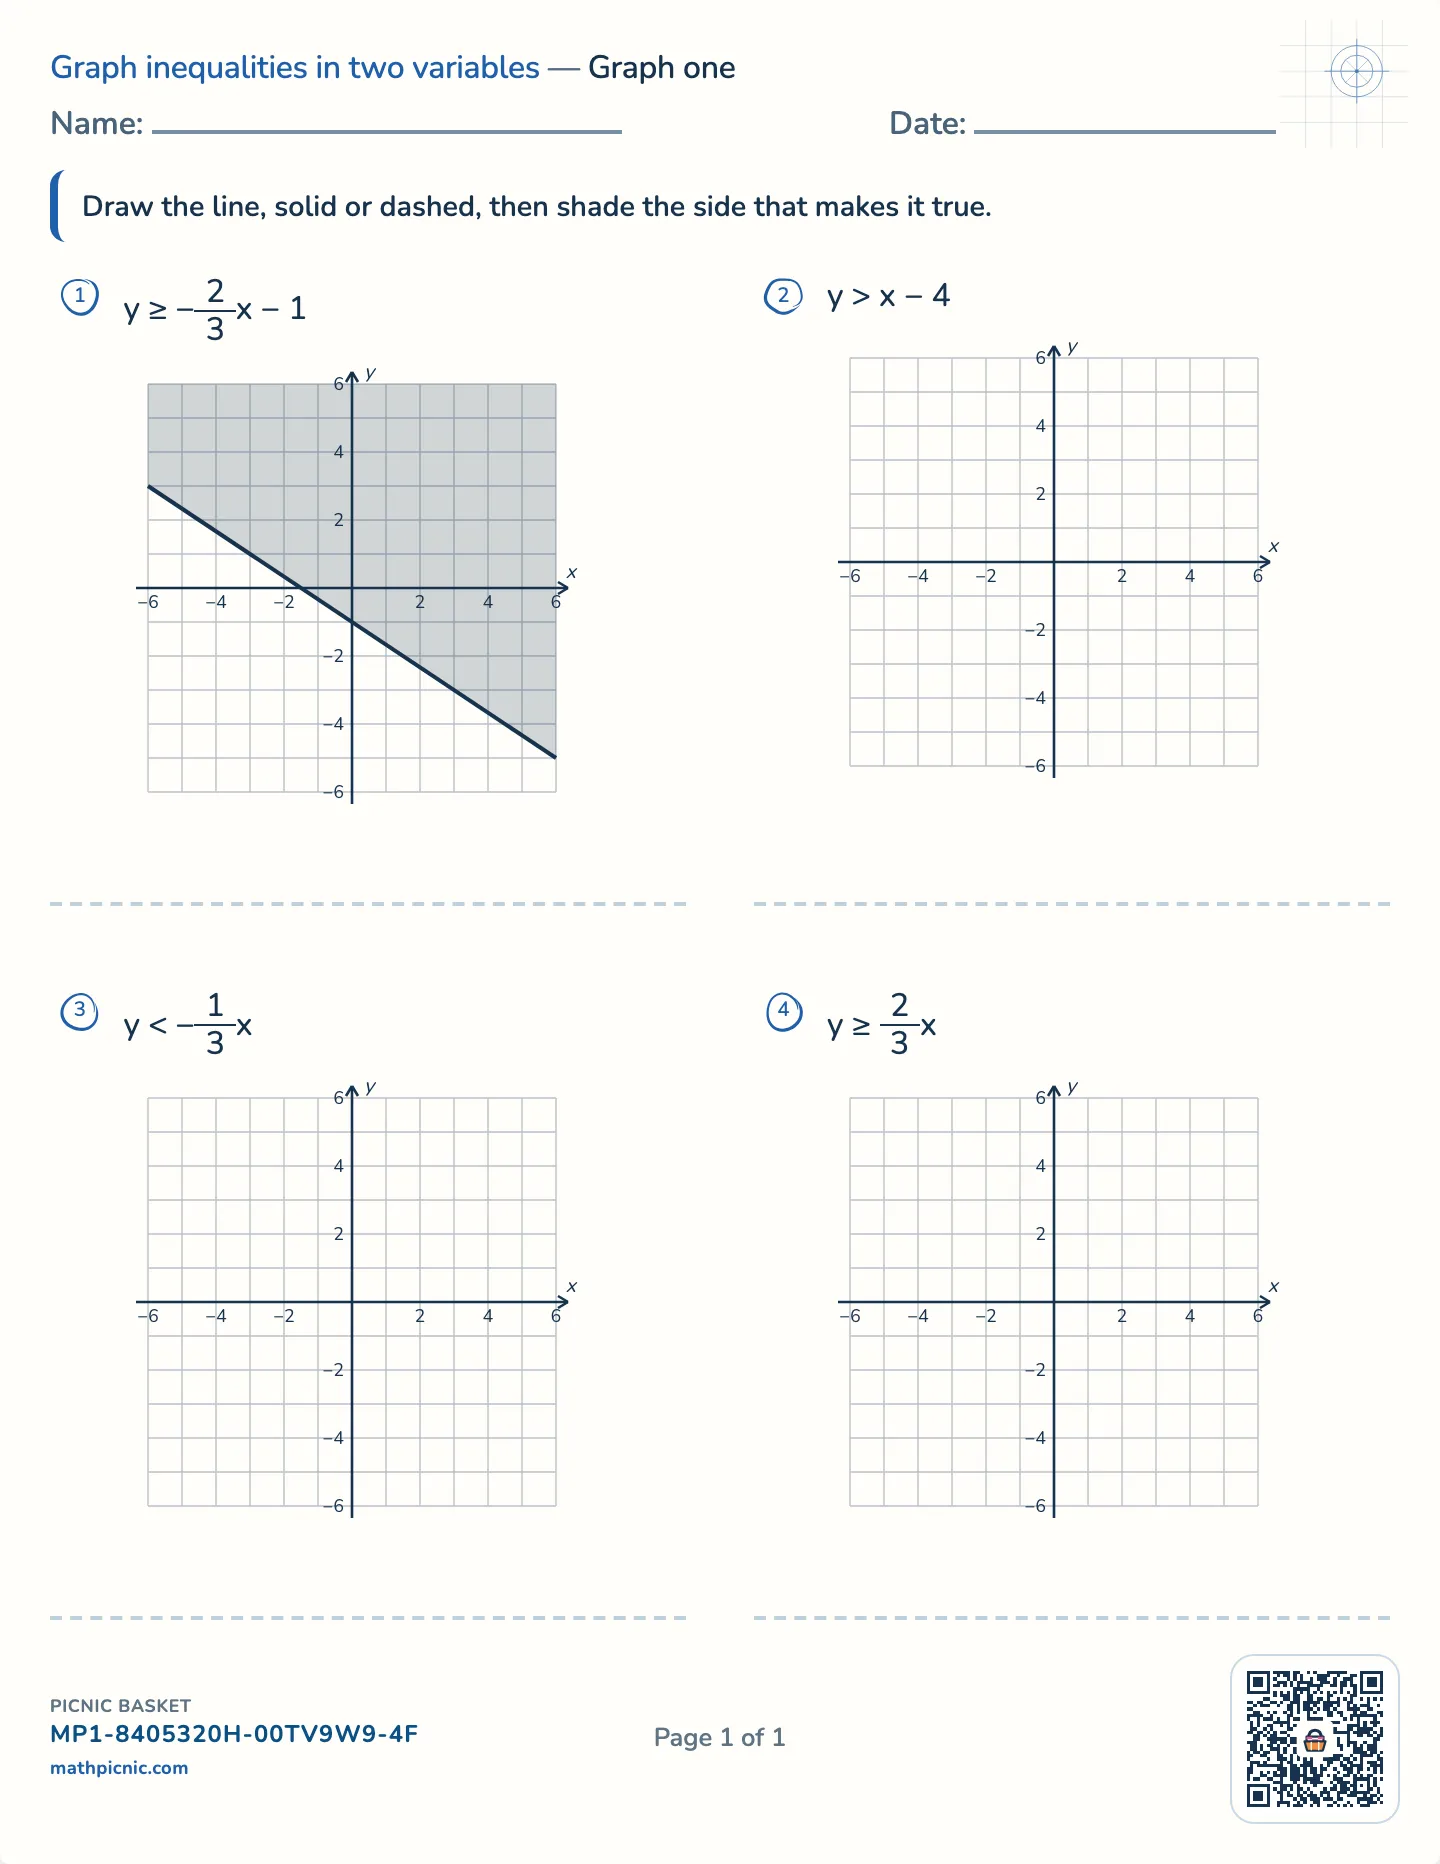
Draw the line, solid or dashed, then shade the side that makes it true.
1y ≥ −23x − 1
2y > x − 4
3y < −13x
4y ≥ 23x

The answer to a linear inequality is a whole region, not a line. These free printable worksheets give an inequality in two variables and an empty grid, and the answer sheet shows the boundary and the shading.
If they get stuck
The answer key prints on a separate page.
There are exactly two decisions. First the boundary: a sign with a bar, ≤ or ≥, includes the line, so it is drawn solid. A sign with no bar leaves it out, so it is dashed. Then the side: pick a point that is not on the line, put it in, and shade the side where the statement comes out true.
The test point is worth insisting on, because the shortcut of “greater than means above” fails for an inequality like x > 2, which has no above at all, and for students who have rearranged the inequality and lost track of the sign. A point always works. (0, 0) is the easiest choice unless the line goes through it.
y ≥ −x − 1