Graph inequalities in two variablesWrite from a graph
Name: Date:
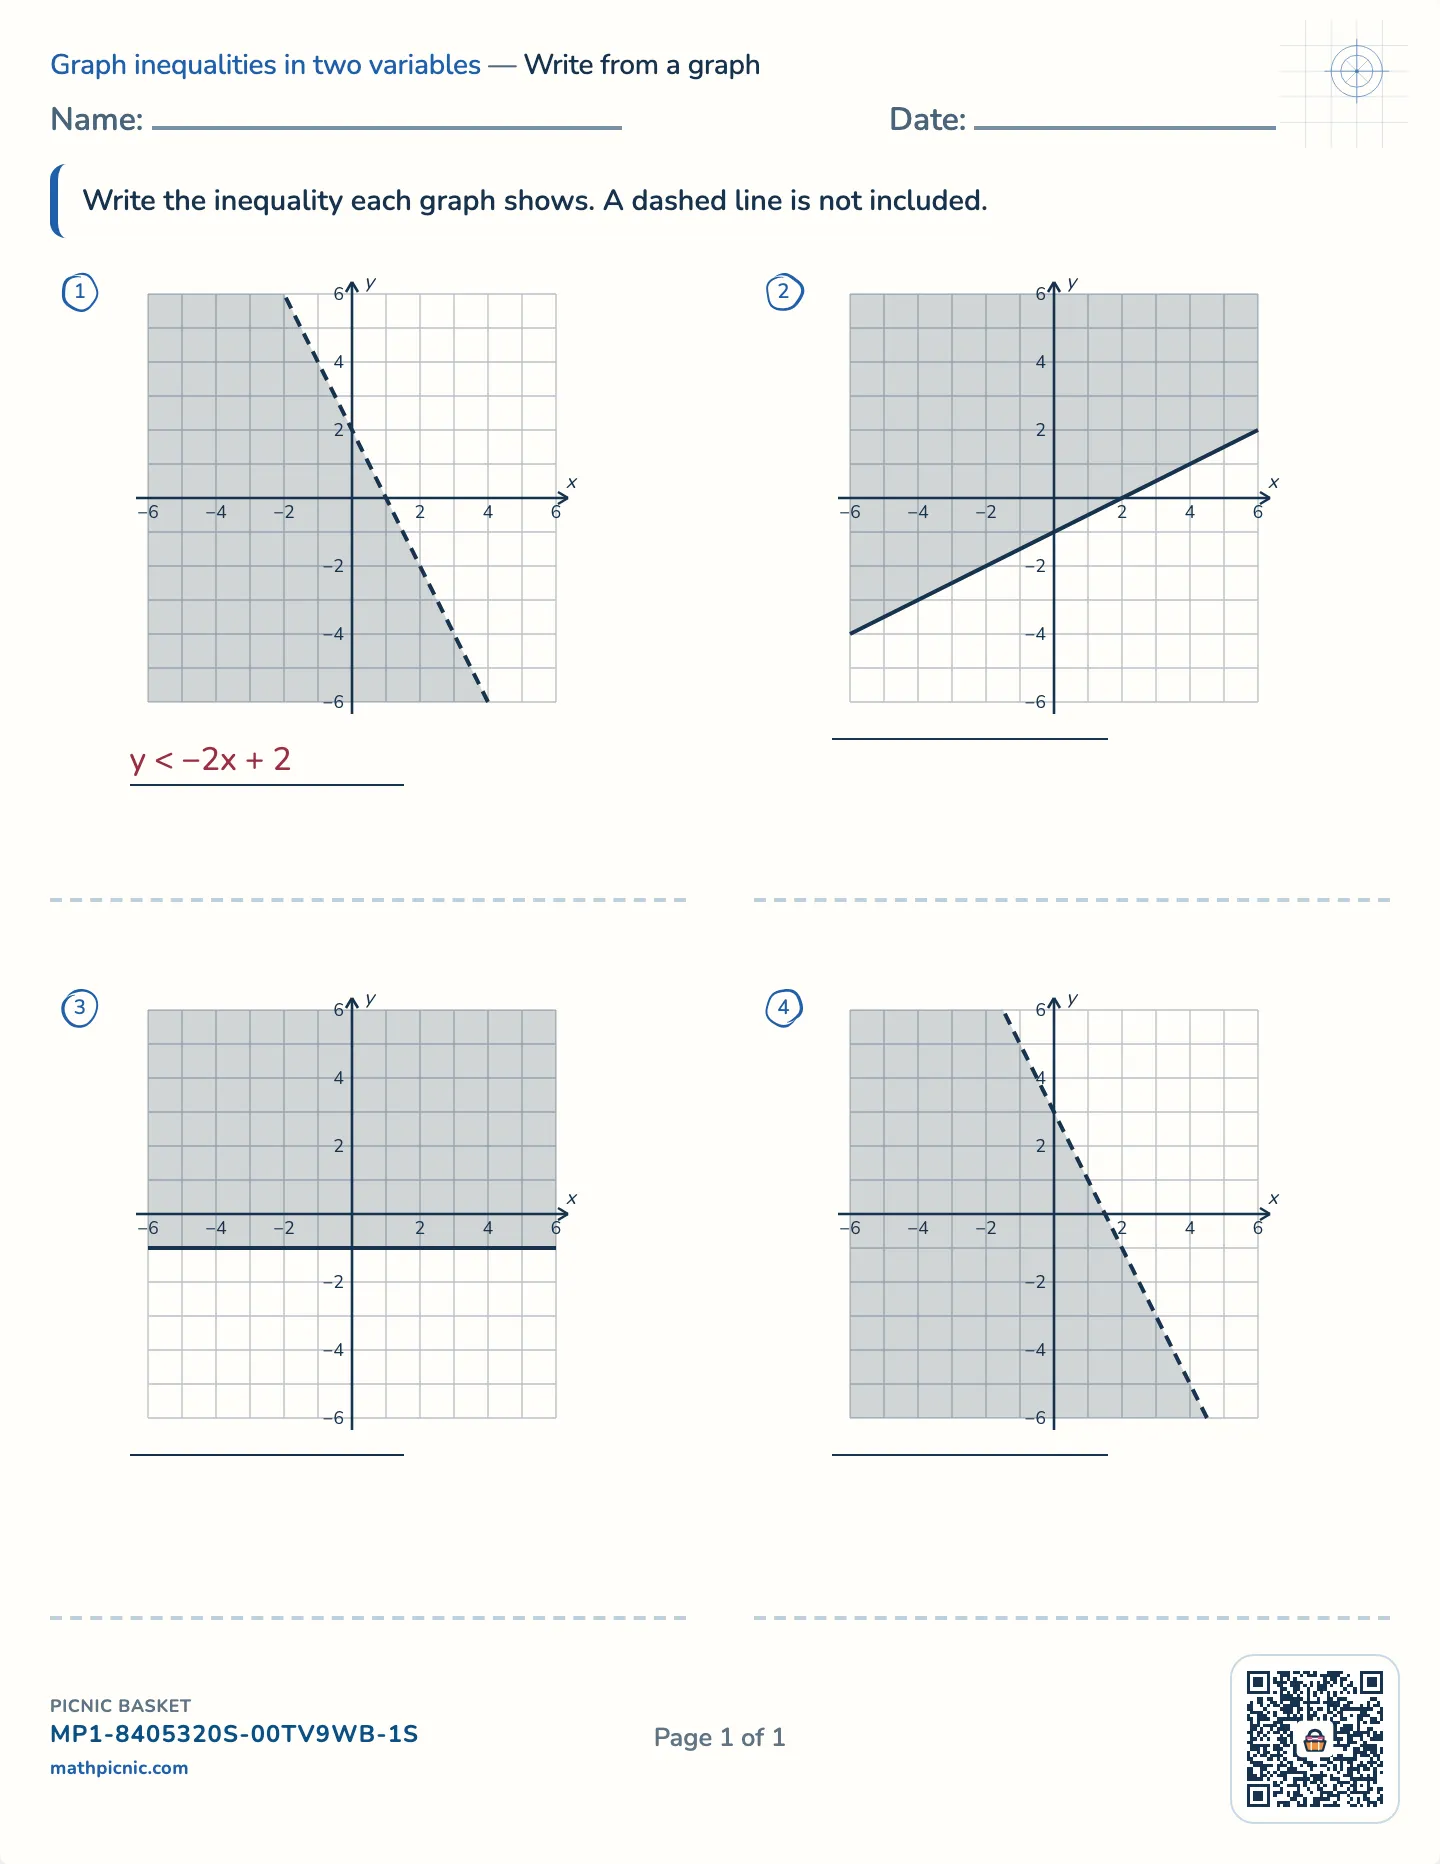
Write the inequality each graph shows. A dashed line is not included.
1
2
3
4

Reading a graph backward asks for everything graphing did, in the opposite order. These free printable worksheets show a shaded region and ask for the inequality that made it, with an answer sheet.
If they get stuck
The answer key prints on a separate page.
The line comes first. Read where it crosses the y-axis and how steeply it climbs, and write its equation as if the sign were an equals sign. Then decide the sign in two steps. A dashed line means no bar and a solid line means a bar, and that settles half of it.
A test point settles the direction. If (0, 0) is in the shading, the finished inequality has to be true there. So try the sign and see: with the line y = 2x − 1, the point (0, 0) gives 0 ≥ −1, which is true, so ≥ is right if the shading covers it. If (0, 0) is outside the shading, the inequality has to come out false there instead.
Write the inequality this graph shows.