
Probability
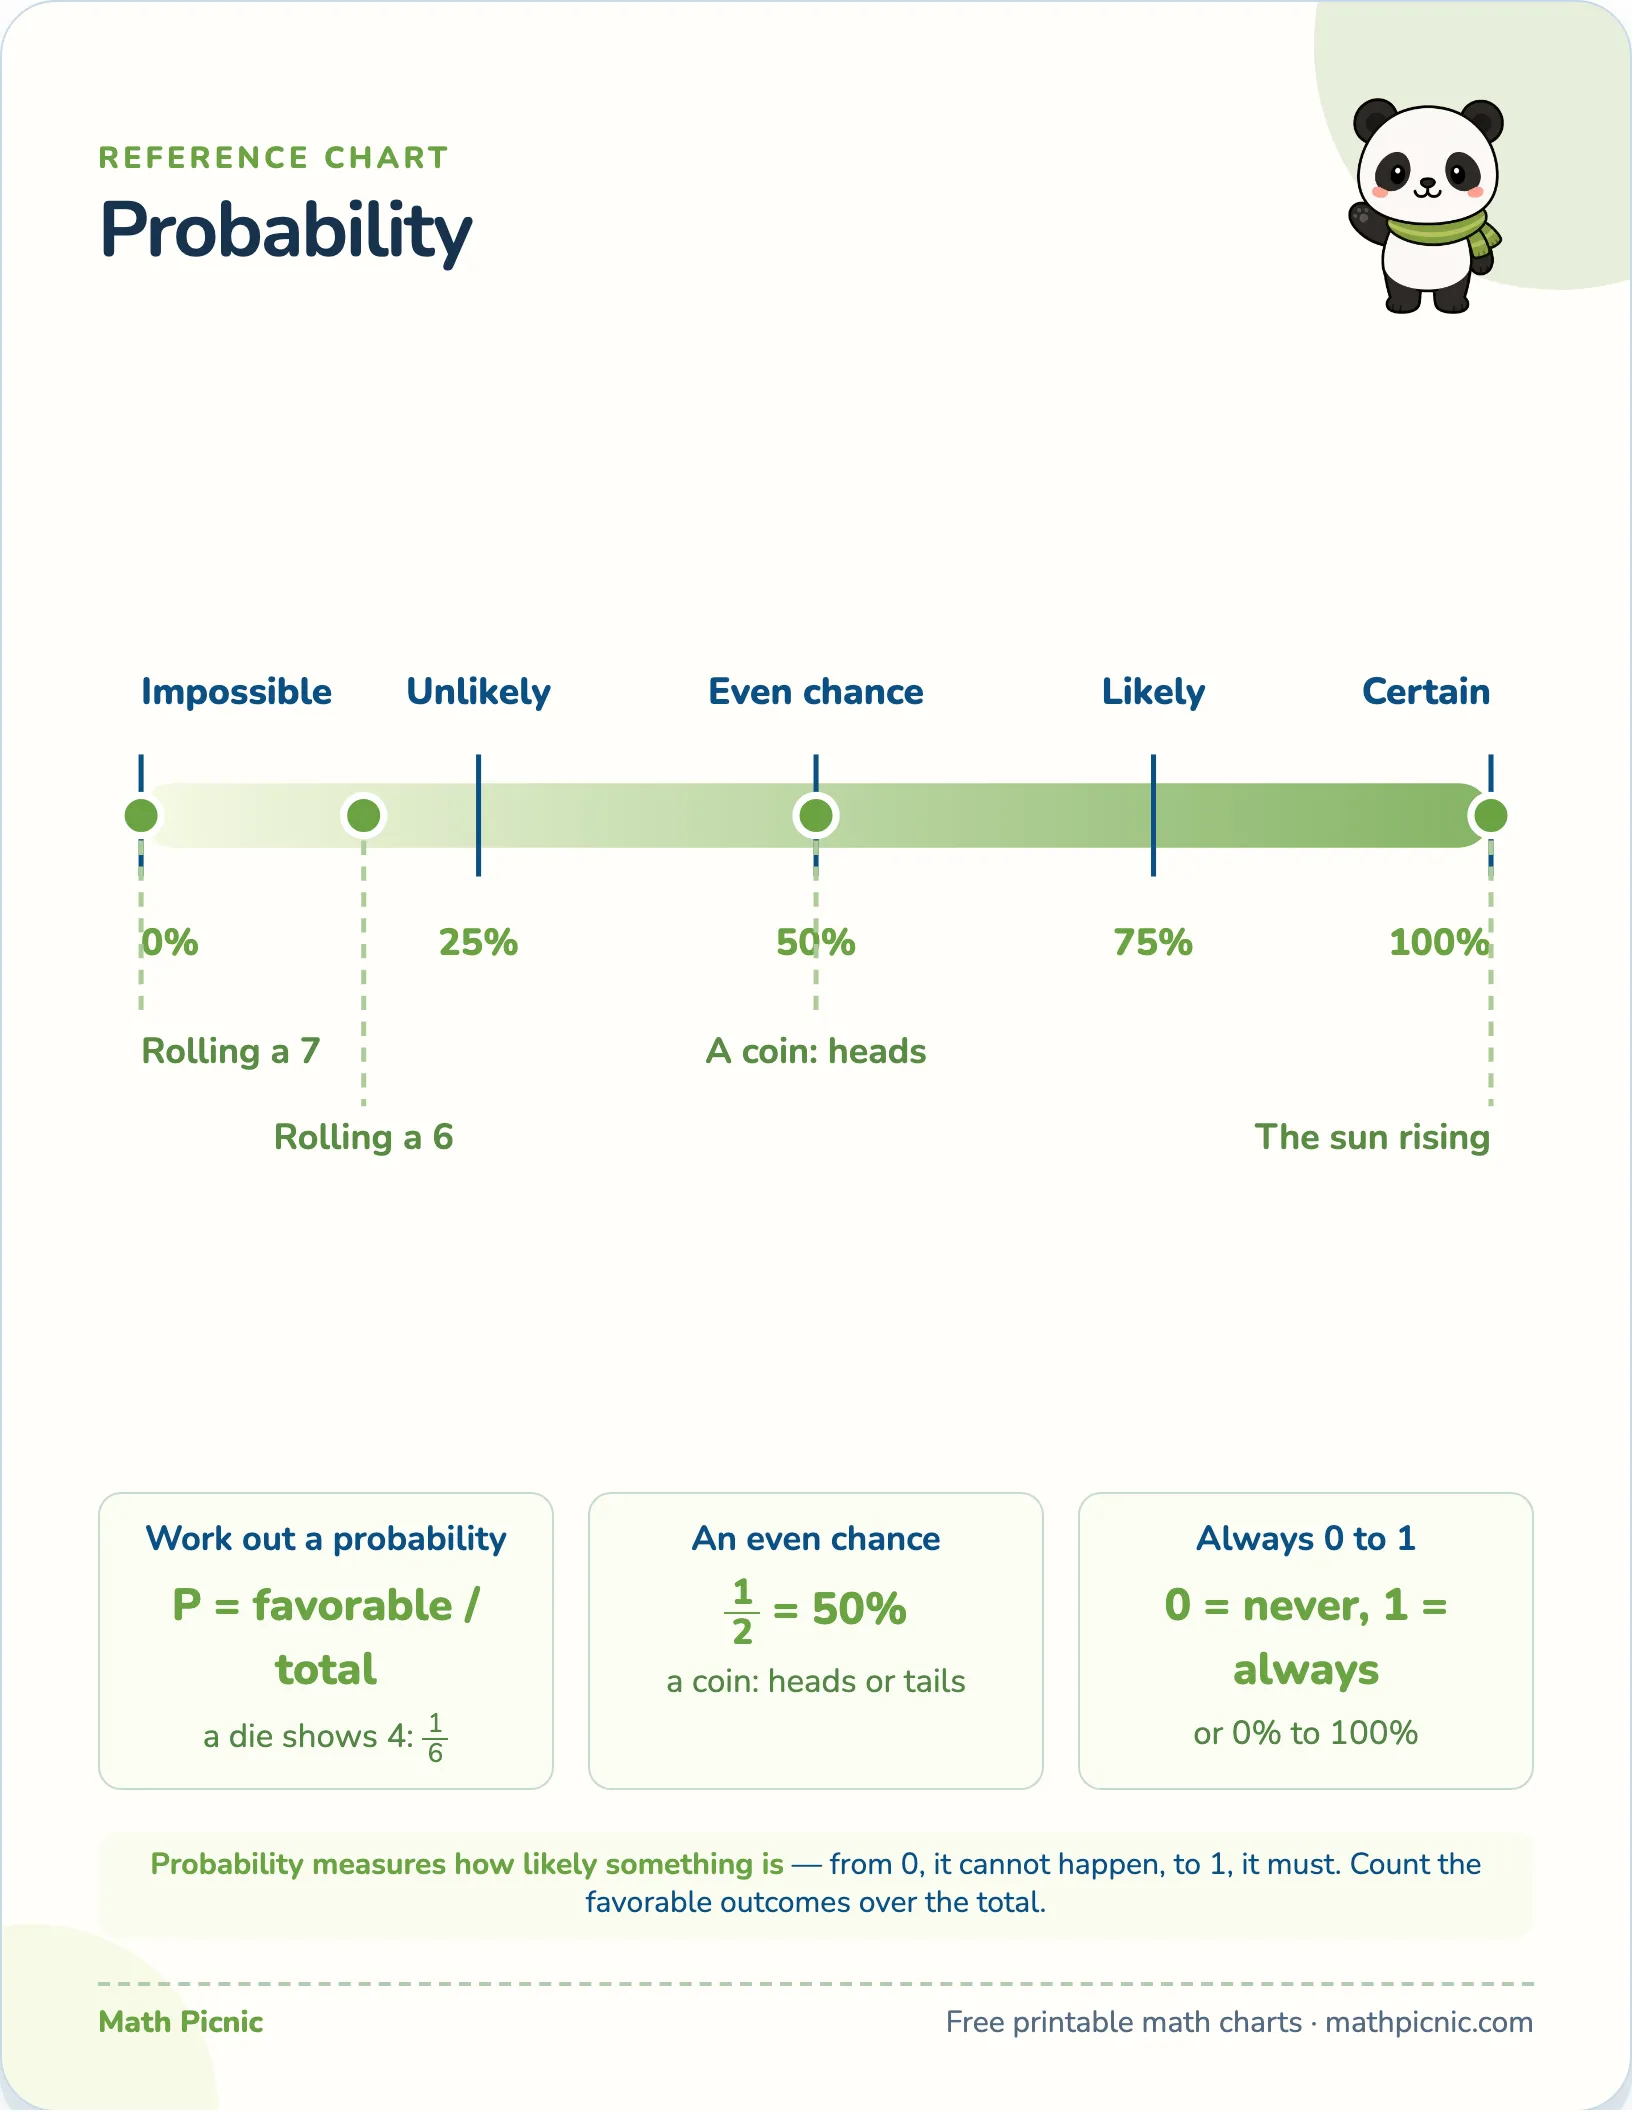
How likely is it? Every answer sits somewhere on one line from 0 to 1 — impossible at one end, certain at the other, an even chance in the middle. Putting real events on that line turns “likely” and “unlikely” into places a child can point at.
Reference chart
Probability

Work out a probability
P = favorable / total
a die shows 4: 16
An even chance
12 = 50%
a coin: heads or tails
Always 0 to 1
0 = never, 1 = always
or 0% to 100%
Probability measures how likely something is — from 0, it cannot happen, to 1, it must. Count the favorable outcomes over the total.
What's on this chart
Probability is a number between 0 and 1, and the line is the fastest way to feel what that number means. Something that cannot happen — rolling a 7 on an ordinary die — sits at 0. Something certain — the sun rising — sits at 1. A coin landing heads is exactly halfway, an even chance. Read the line left to right and the words and the percentages climb together, so “unlikely” and 25% name the same place.
Why this chart helps
The number itself comes from counting, and it is the one procedure on the page: probability is the favorable outcomes over the total. A die has six faces and one is a 4, so the chance of a 4 is 1/6. Six faces, three of them even, so an even number is 3/6, which is 1/2 — the same halfway point the coin sits on. Every probability is a fraction like these, which is why the line runs from 0 to 1 and never past it.
More printable charts
- Counting to 10
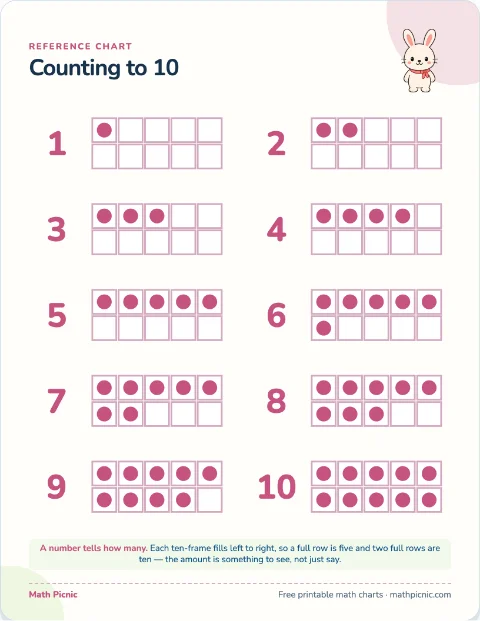 Print Count the dots in each ten-frame and read the number beside it.
 - Number bonds to 10
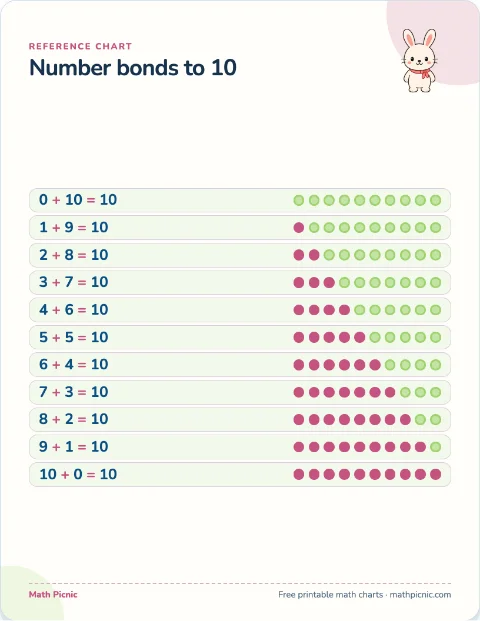 Print Read each row of counters and say the two numbers that make ten.
 - Comparing numbers
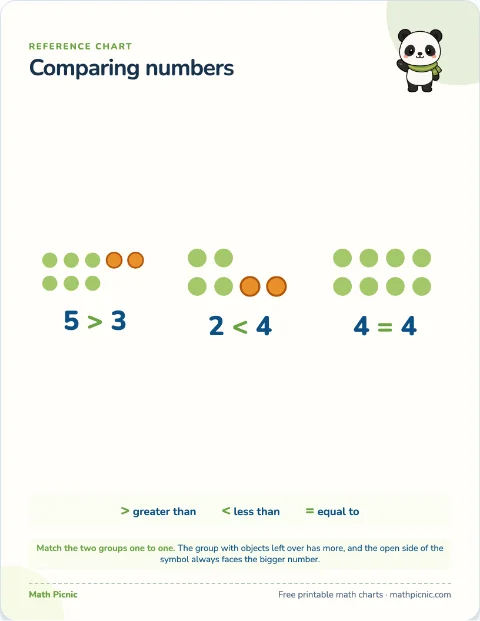 Print Line the two groups up one to one; the group with a leftover has more.
 - Odd and even
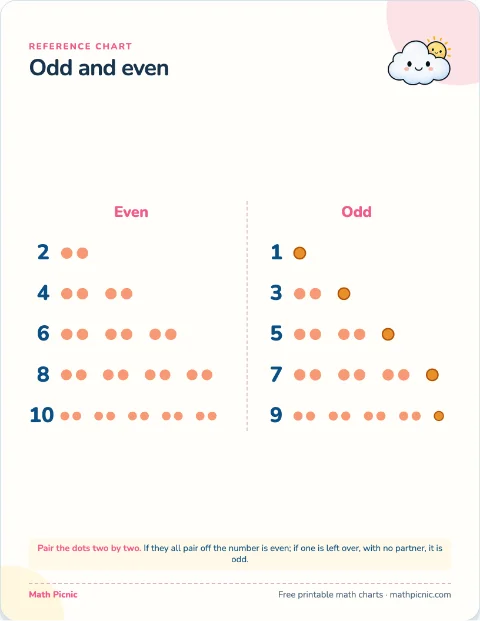 Print Pair the dots two by two; all paired is even, one left over is odd.
 - Number line 0–20
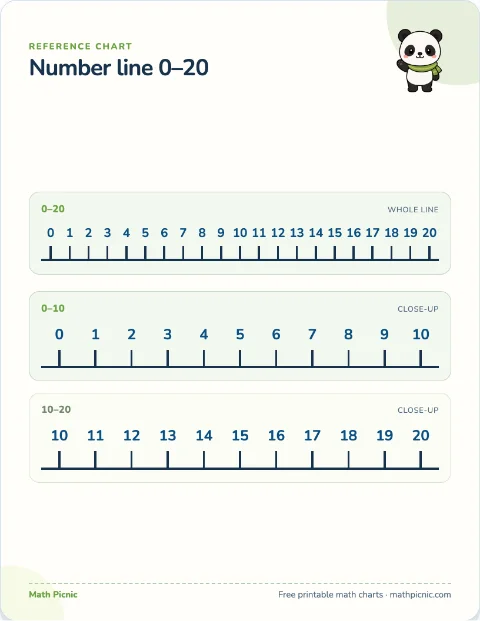 Print Count on or back by hopping along the line one number at a time.
 - Blank number line 0–20
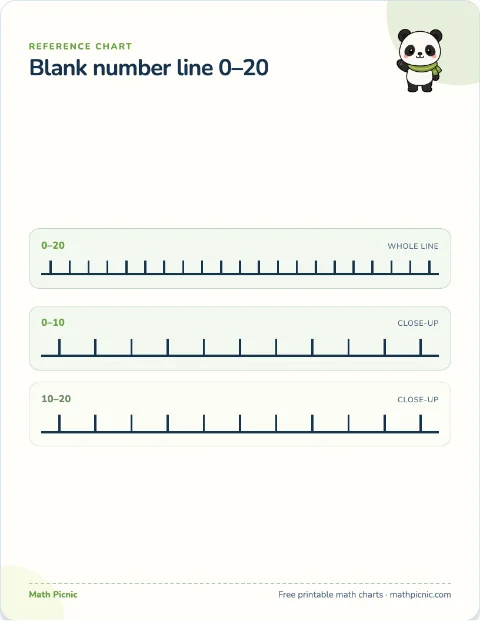 Print Label the ticks, mark a number, or draw equal jumps for an operation.
 - Number bonds to 20
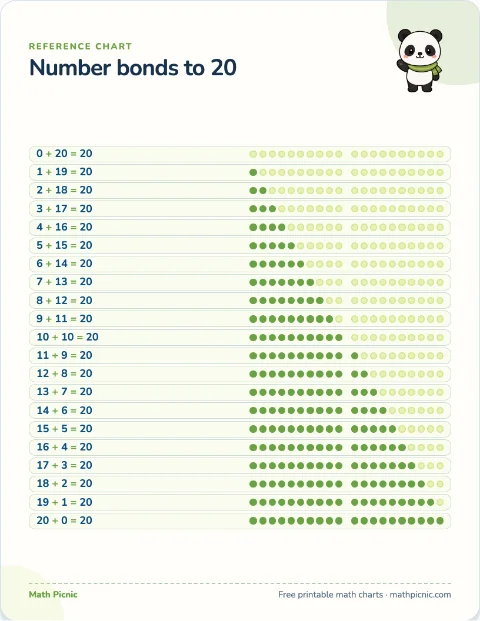 Print Count the two colors in a row and say the pair that makes twenty.
 - Telling the time
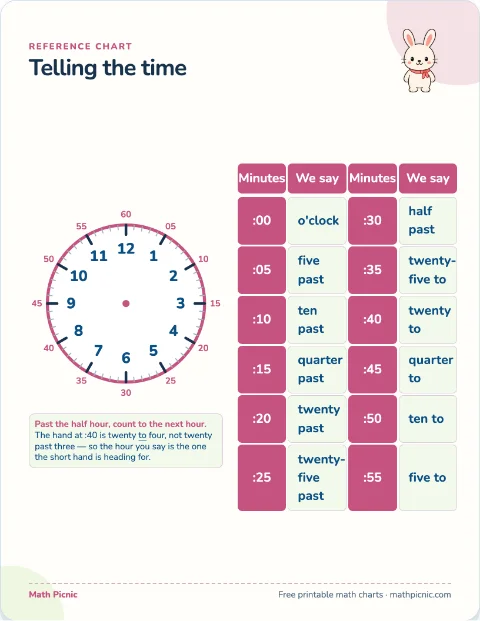 Print Read the hour inside the dial and the minutes printed outside it.