
Function notation
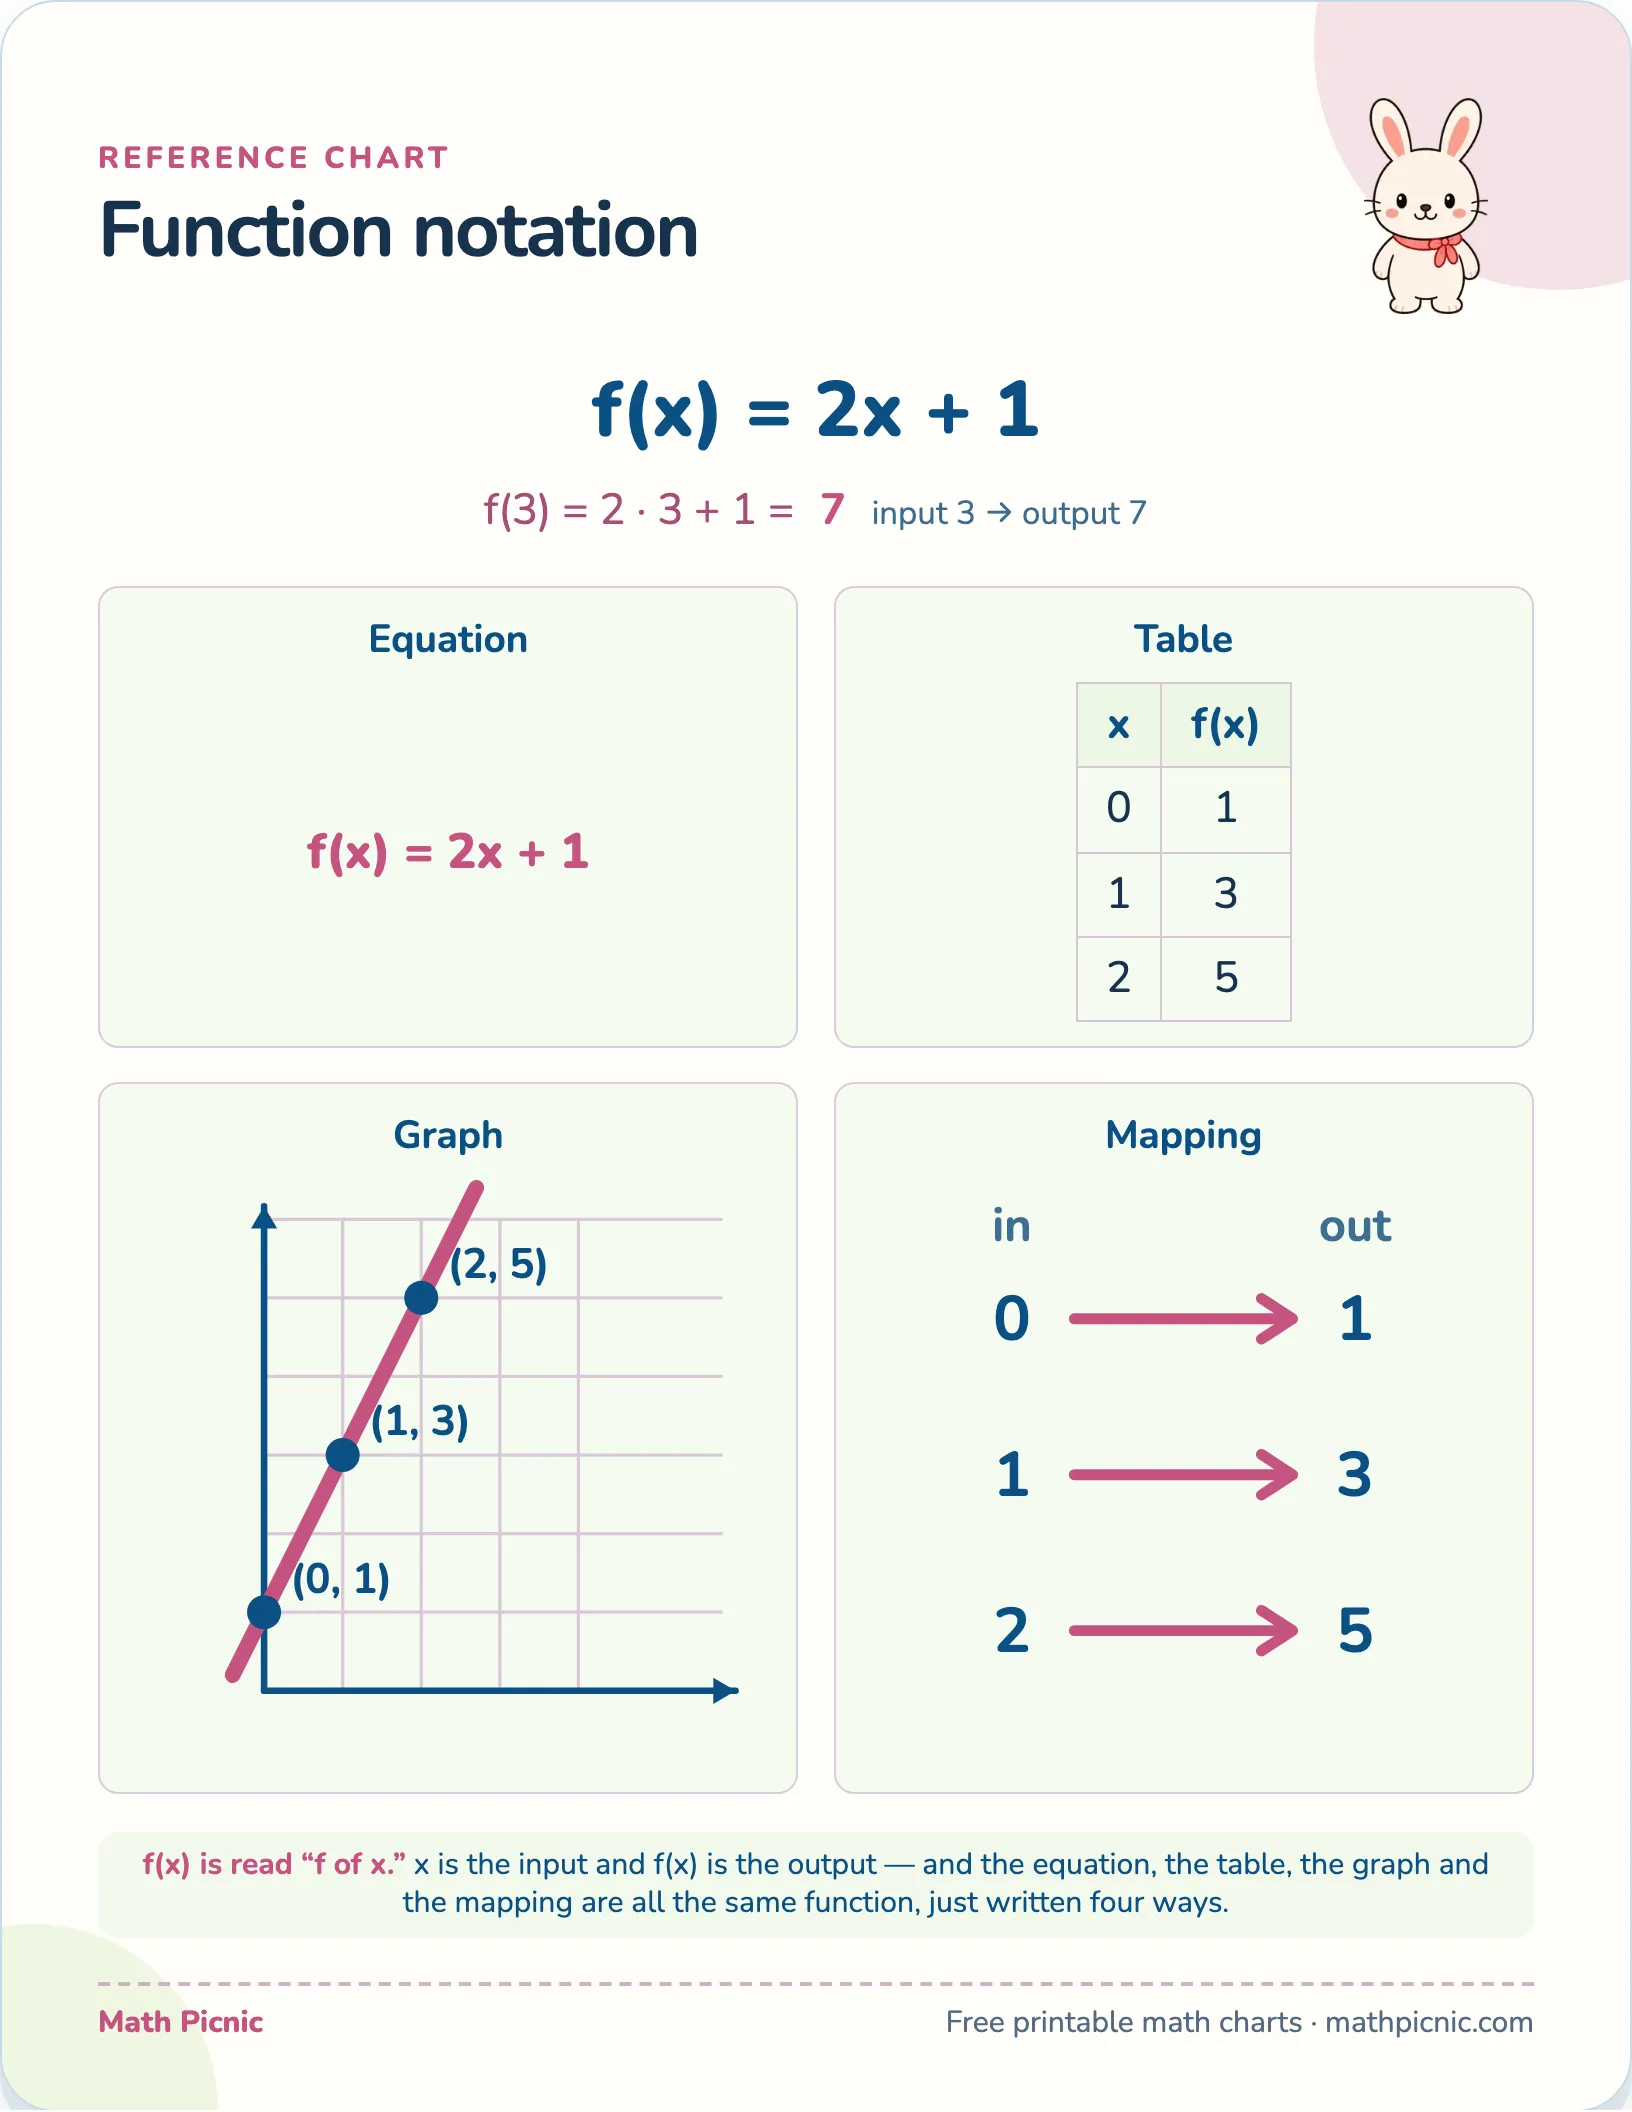
f(x) is read “f of x”: x goes in, f(x) comes out. This chart evaluates one function and then shows it four ways — equation, table, graph and mapping — so the notation stops being mysterious.
Reference chart
Function notation

f(x) = 2x + 1
f(3) = 2 · 3 + 1 = 7input 3 → output 7
Equation
f(x) = 2x + 1
Table
| x | f(x) |
|---|---|
| 0 | 1 |
| 1 | 3 |
| 2 | 5 |
Graph
Mapping
f(x) is read “f of x.” x is the input and f(x) is the output — and the equation, the table, the graph and the mapping are all the same function, just written four ways.
What's on this chart
A function is a rule that turns each input into exactly one output, and f(x) is the notation for it: the name of the rule is f, the input goes in the brackets, and the whole thing stands for the output. So f(3) does not mean f times 3 — it means “put 3 into the rule f and see what comes out.” For f(x) = 2x + 1, that is 2 · 3 + 1 = 7.
Why this chart helps
The same function can be written more than one way, and recognizing that is half of what this topic asks. The equation is the rule; a table lists inputs beside their outputs; a graph plots each input-output pair as a point; and a mapping draws an arrow from each input to its output. This chart shows all four for f(x) = 2x + 1, so a student can see that they are one thing, not four.
More printable charts
- The quadratic formula
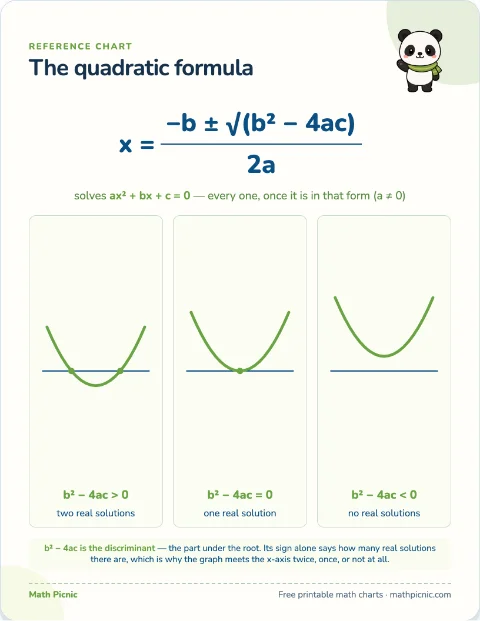 Print Put the equation in standard form, then read a, b and c into the formula.
 - Factoring patterns
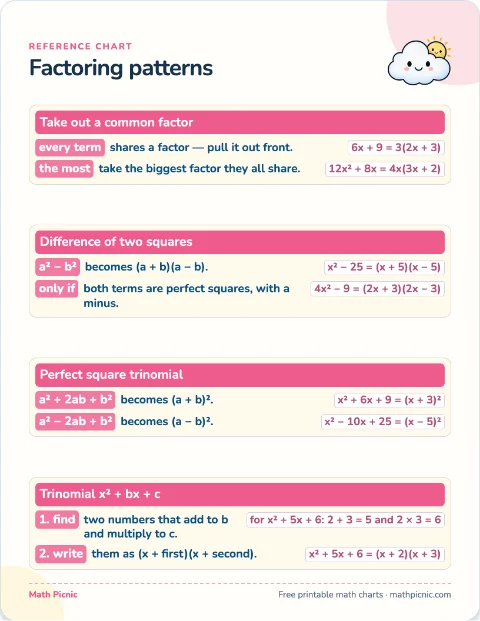 Print Spot which pattern the expression fits, then read the factors off it.
 - Solving systems
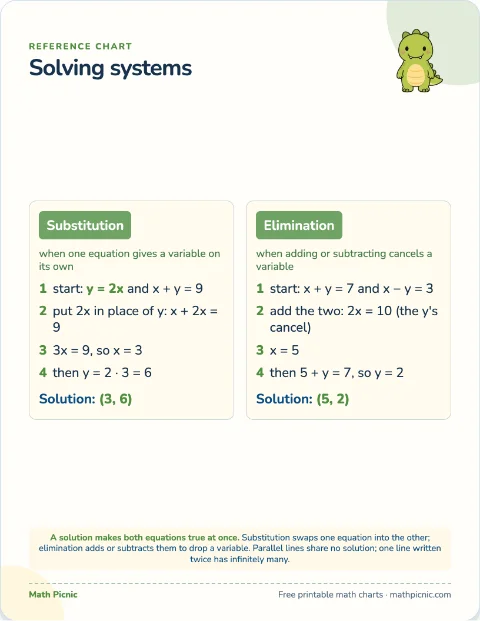 Print Pick the method that fits, then follow the worked steps beside it.
 - Laws of logarithms
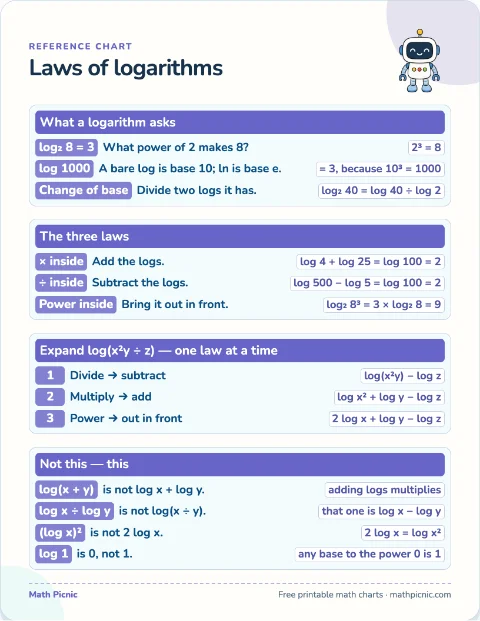 Print Match what is inside the log to a law, then follow the numbered expansion.