
Mean, median, mode and range
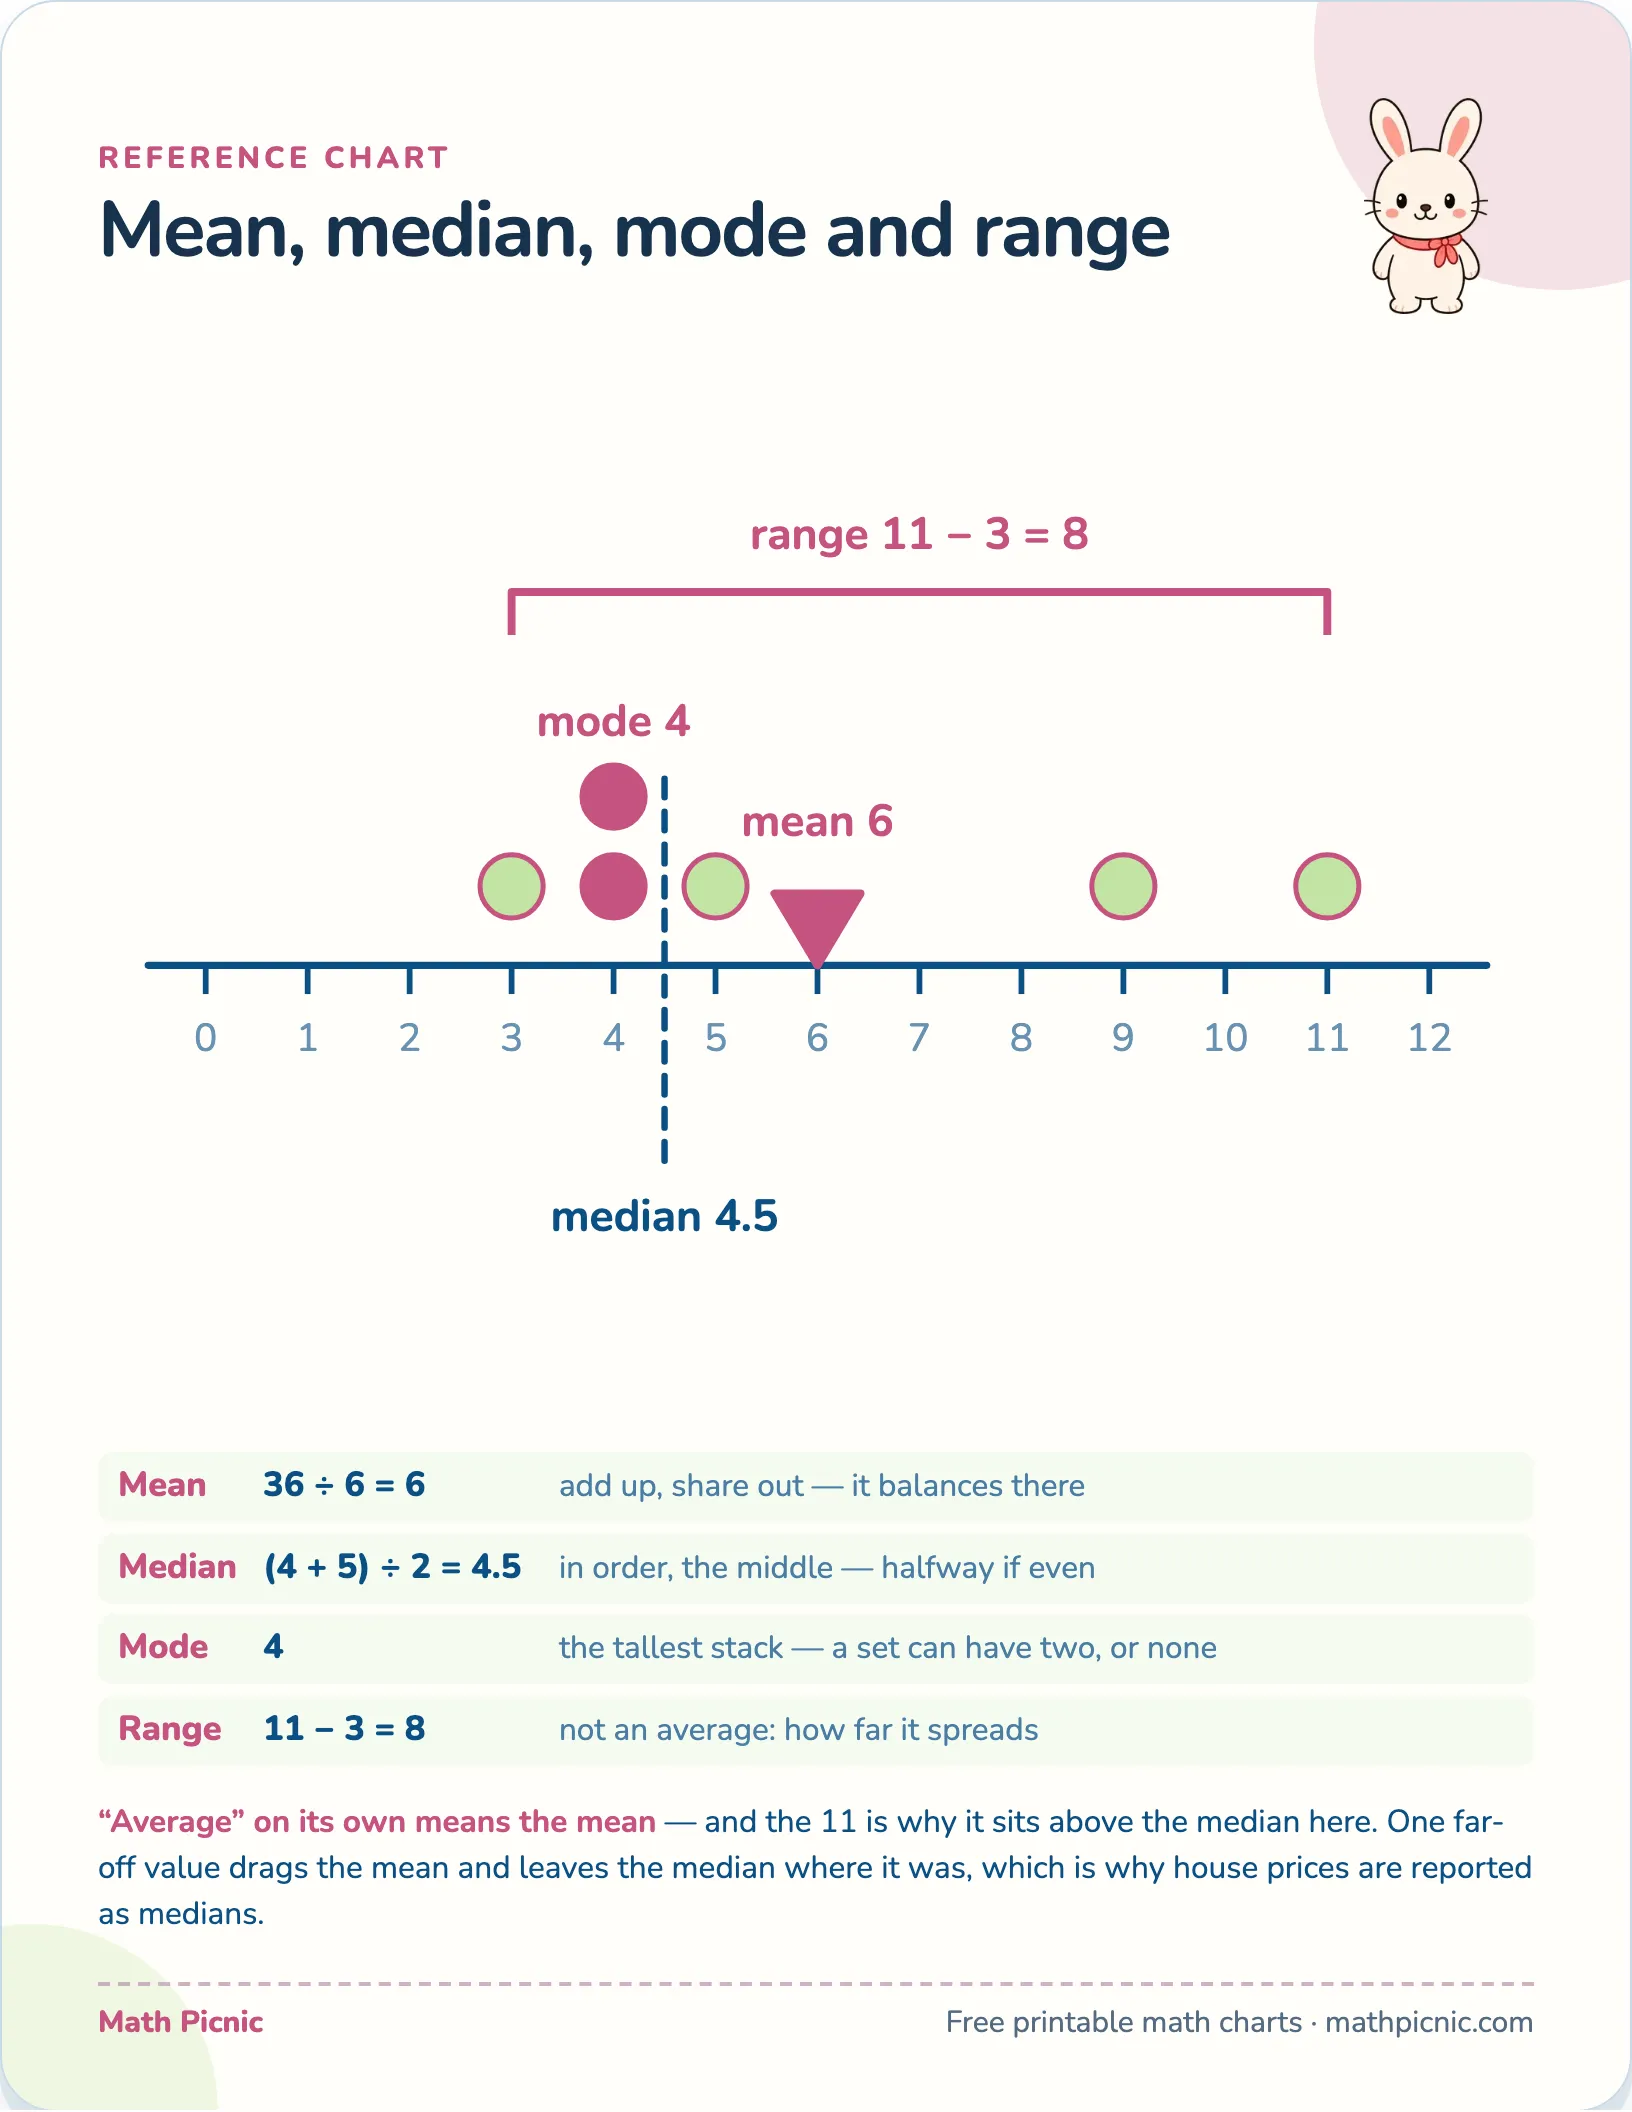
Four words for four different questions, worked on one set of six numbers so the answers can be compared side by side: mean 6, median 4.5, mode 4, range 8.
Reference chart
Mean, median, mode and range

“Average” on its own means the mean — and the 11 is why it sits above the median here. One far-off value drags the mean and leaves the median where it was, which is why house prices are reported as medians.
What's on this chart
The definitions are one line each and they are not the hard part. The hard part is that three of these are called “the average” in ordinary conversation, so a child who has met them in separate lessons has three procedures and no way to tell which one a question wants. Running all four down one set of numbers is what makes the difference visible.
Why this chart helps
The numbers on the chart are chosen so no two answers coincide. A set where the mean and the median come out the same is the set that teaches a child they are interchangeable, and they are not — the whole reason both exist is that one value far from the rest moves the mean and leaves the median alone. That is why salaries and house prices are reported as medians and almost nothing else is.
More printable charts
- Counting to 10
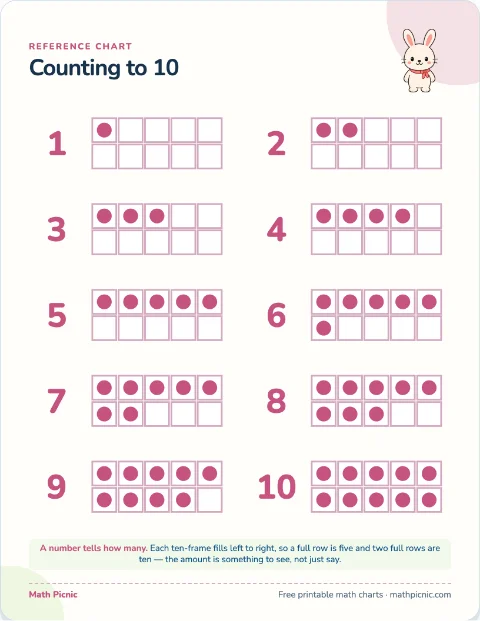 Print Count the dots in each ten-frame and read the number beside it.
 - Number bonds to 10
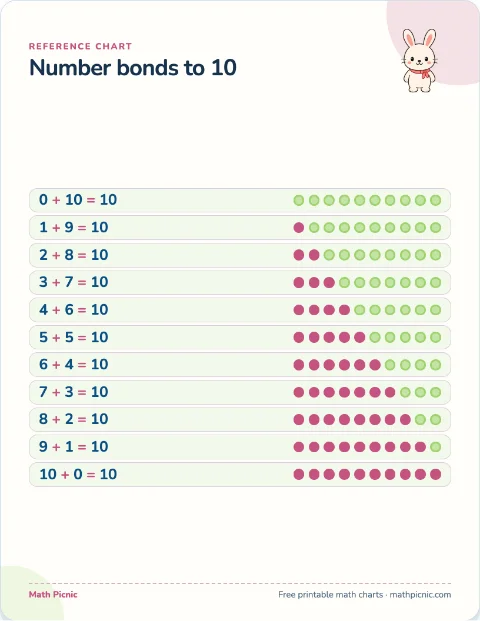 Print Read each row of counters and say the two numbers that make ten.
 - Comparing numbers
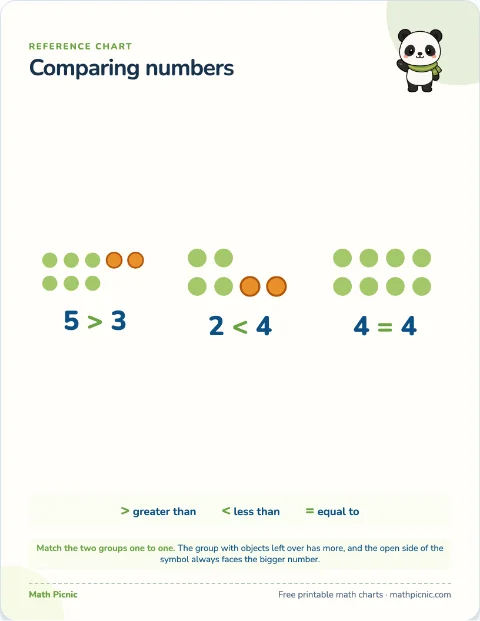 Print Line the two groups up one to one; the group with a leftover has more.
 - Odd and even
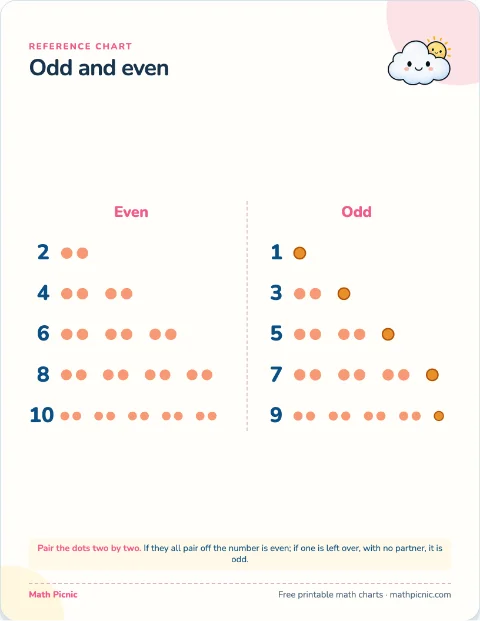 Print Pair the dots two by two; all paired is even, one left over is odd.
 - Number line 0–20
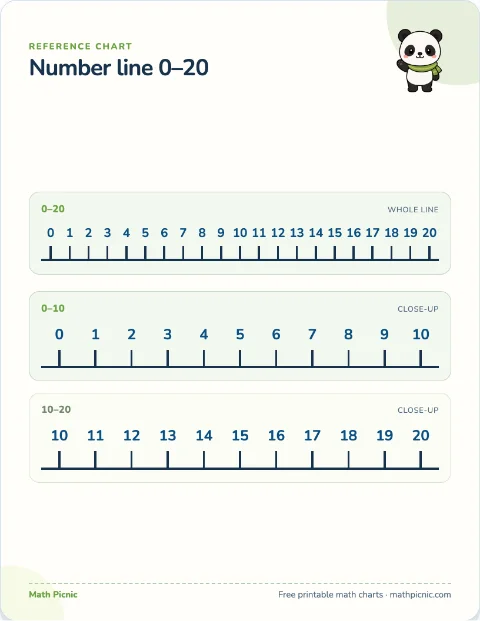 Print Count on or back by hopping along the line one number at a time.
 - Blank number line 0–20
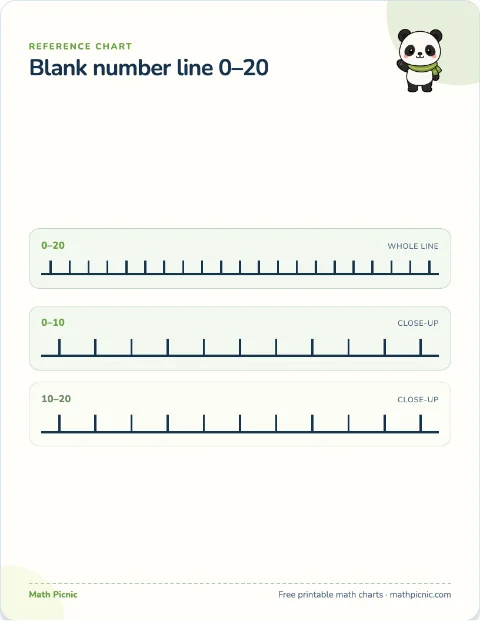 Print Label the ticks, mark a number, or draw equal jumps for an operation.
 - Number bonds to 20
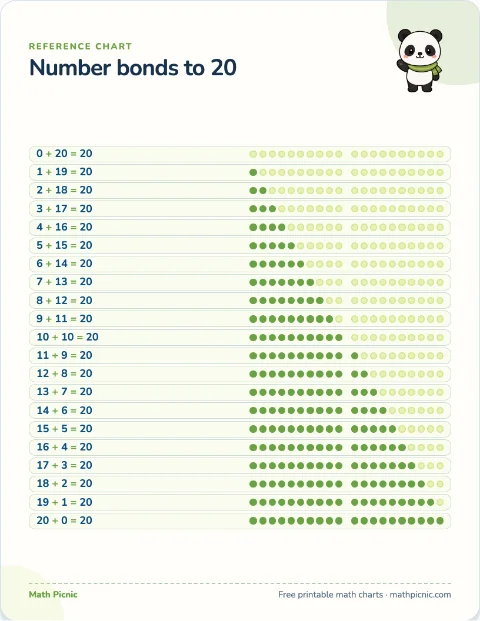 Print Count the two colors in a row and say the pair that makes twenty.
 - Telling the time
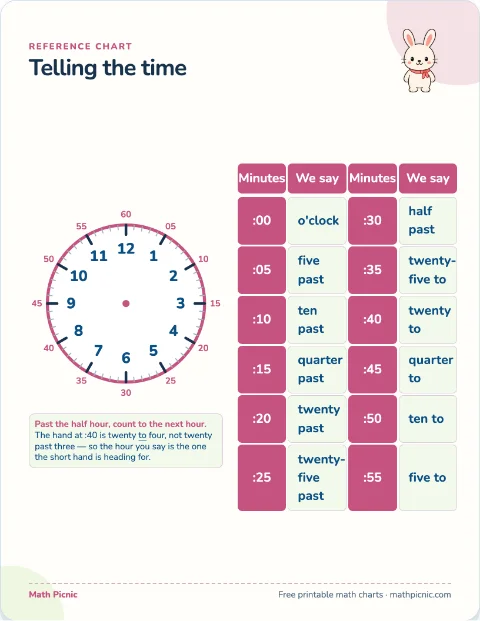 Print Read the hour inside the dial and the minutes printed outside it.