
Subtraction facts, taking away up to 10
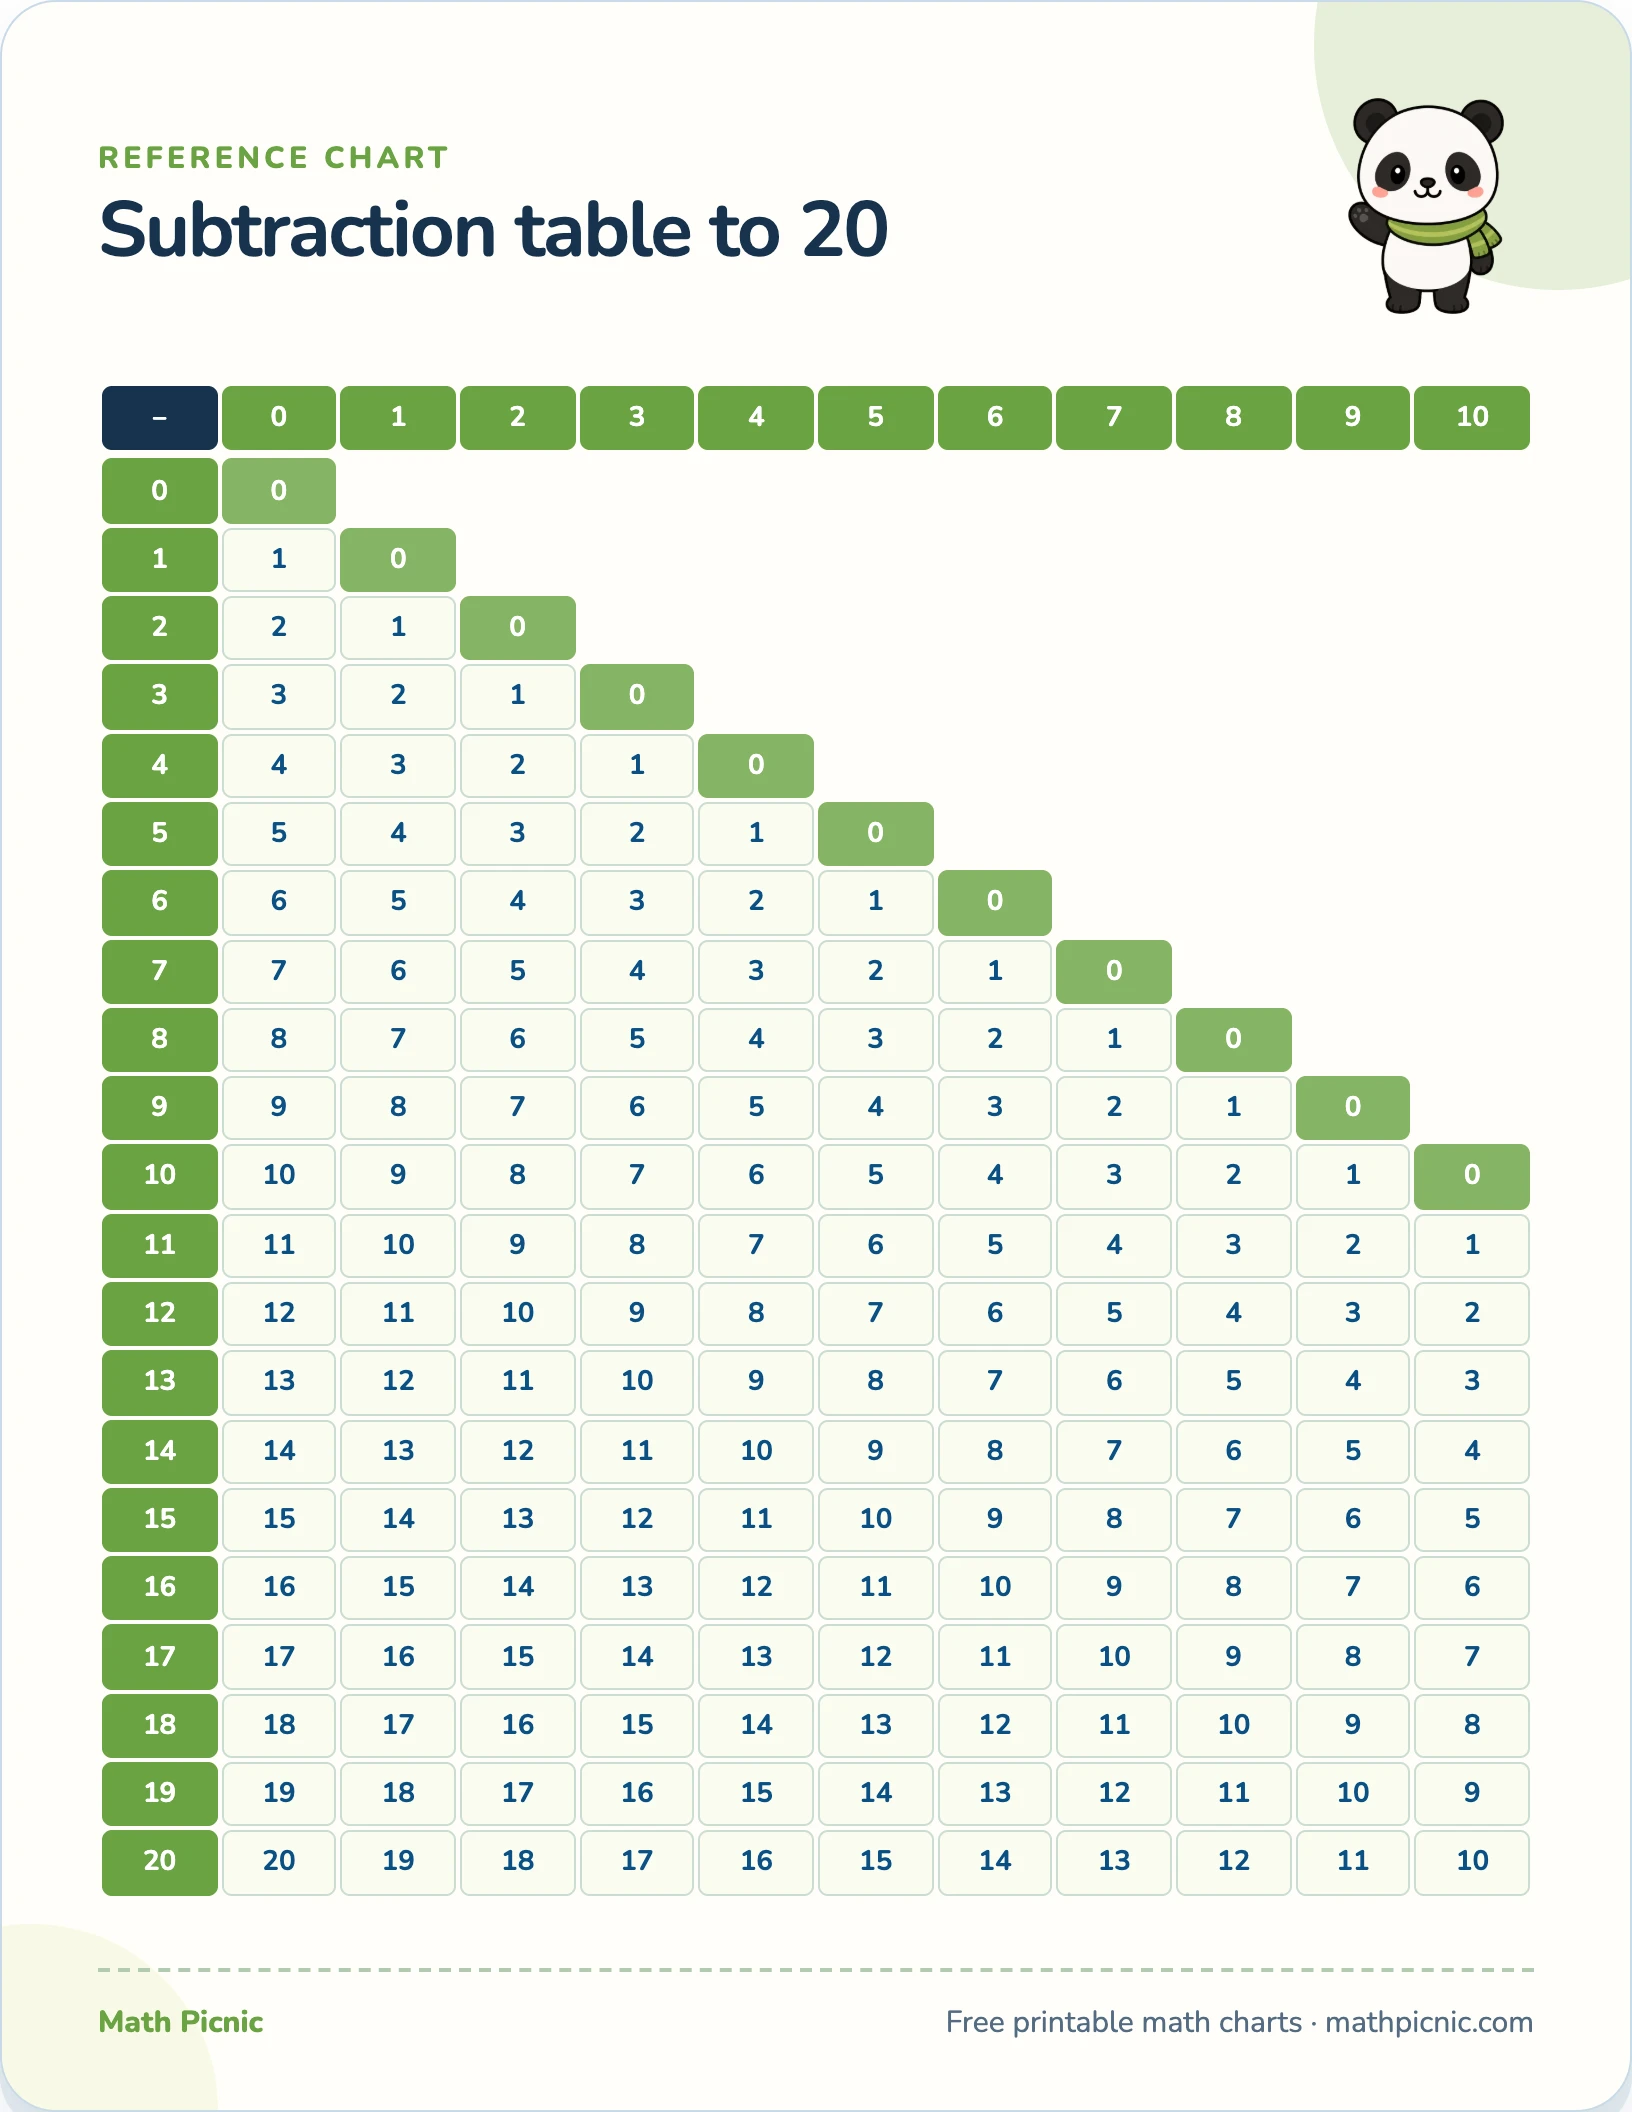
A subtraction chart built the way children actually read one: find the number you start with on the left, follow the row across to what you are taking away, and the answer is sitting there.
Reference chart
Subtraction facts, taking away up to 10

| − | 0 | 1 | 2 | 3 | 4 | 5 | 6 | 7 | 8 | 9 | 10 |
|---|---|---|---|---|---|---|---|---|---|---|---|
| 0 | 0 | ||||||||||
| 1 | 1 | 0 | |||||||||
| 2 | 2 | 1 | 0 | ||||||||
| 3 | 3 | 2 | 1 | 0 | |||||||
| 4 | 4 | 3 | 2 | 1 | 0 | ||||||
| 5 | 5 | 4 | 3 | 2 | 1 | 0 | |||||
| 6 | 6 | 5 | 4 | 3 | 2 | 1 | 0 | ||||
| 7 | 7 | 6 | 5 | 4 | 3 | 2 | 1 | 0 | |||
| 8 | 8 | 7 | 6 | 5 | 4 | 3 | 2 | 1 | 0 | ||
| 9 | 9 | 8 | 7 | 6 | 5 | 4 | 3 | 2 | 1 | 0 | |
| 10 | 10 | 9 | 8 | 7 | 6 | 5 | 4 | 3 | 2 | 1 | 0 |
| 11 | 11 | 10 | 9 | 8 | 7 | 6 | 5 | 4 | 3 | 2 | 1 |
| 12 | 12 | 11 | 10 | 9 | 8 | 7 | 6 | 5 | 4 | 3 | 2 |
| 13 | 13 | 12 | 11 | 10 | 9 | 8 | 7 | 6 | 5 | 4 | 3 |
| 14 | 14 | 13 | 12 | 11 | 10 | 9 | 8 | 7 | 6 | 5 | 4 |
| 15 | 15 | 14 | 13 | 12 | 11 | 10 | 9 | 8 | 7 | 6 | 5 |
| 16 | 16 | 15 | 14 | 13 | 12 | 11 | 10 | 9 | 8 | 7 | 6 |
| 17 | 17 | 16 | 15 | 14 | 13 | 12 | 11 | 10 | 9 | 8 | 7 |
| 18 | 18 | 17 | 16 | 15 | 14 | 13 | 12 | 11 | 10 | 9 | 8 |
| 19 | 19 | 18 | 17 | 16 | 15 | 14 | 13 | 12 | 11 | 10 | 9 |
| 20 | 20 | 19 | 18 | 17 | 16 | 15 | 14 | 13 | 12 | 11 | 10 |
What's on this chart
Subtraction charts are rarer than addition charts, and the reason is that half the grid would hold negative numbers. This one is cut to the triangle that makes sense for a young child: every row stops where the answer would fall below zero, so nothing on the page needs explaining away.
Why this chart helps
Read across a row and the countdown is obvious — 12−1, 12−2, 12−3 each step down by one. Read down a column and the answers step up instead. Those two directions are the same fact family seen from either end, and a child who can move both ways on this chart is close to not needing it.
More printable charts
- Hundreds chart
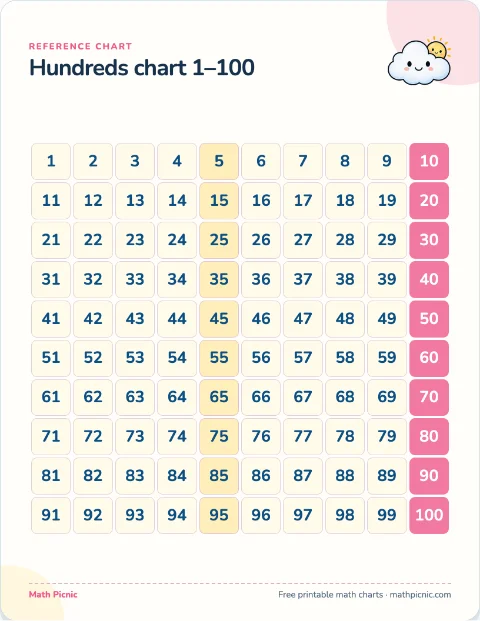 Print Count, skip count, or add ten by moving one square straight down.
 - Addition table
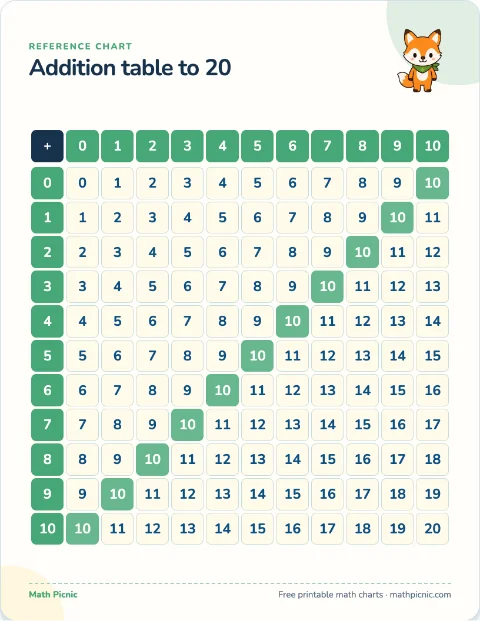 Print Follow a row and a column to the square where the two numbers meet.
 - Subtraction table to 20
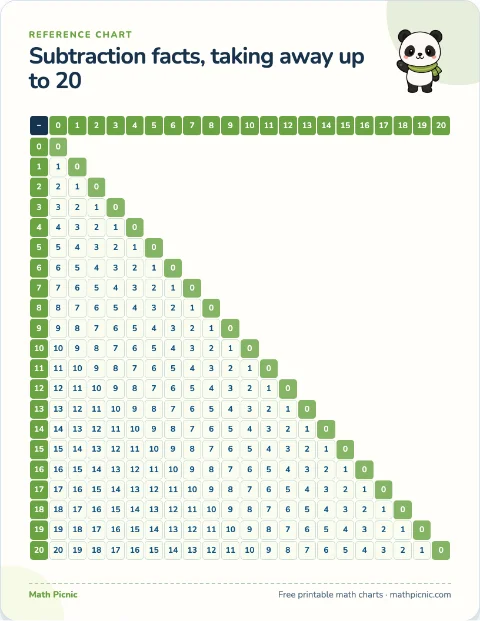 Print Find the top number down the side, the number taken away across the top.
 - Multiplication table
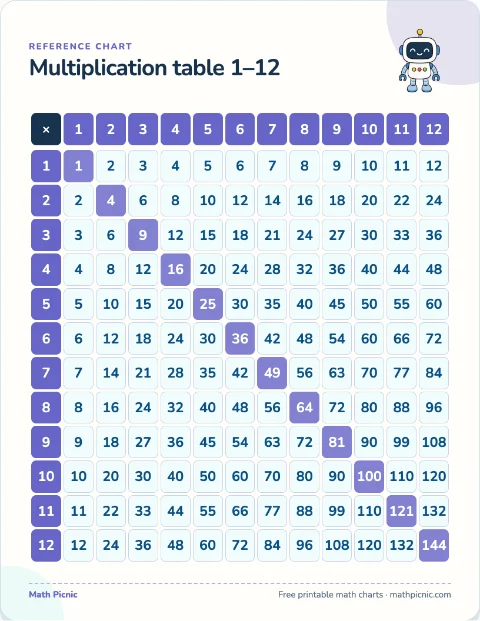 Print Read a row across and a column down to the square where they meet.
 - Division table
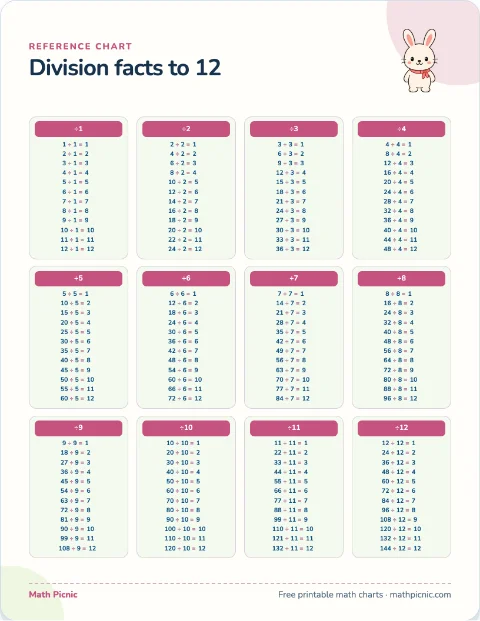 Print Find the family being divided by, then read down it to the answer.
 - Roman numerals
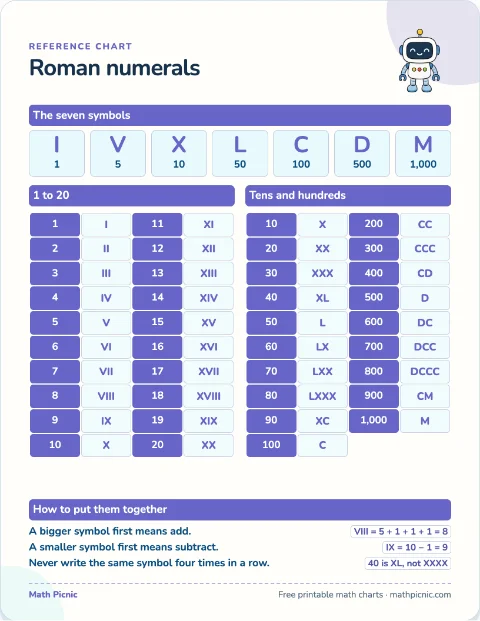 Print Build or read a numeral using the seven symbols and the three rules.
 - Multiples chart
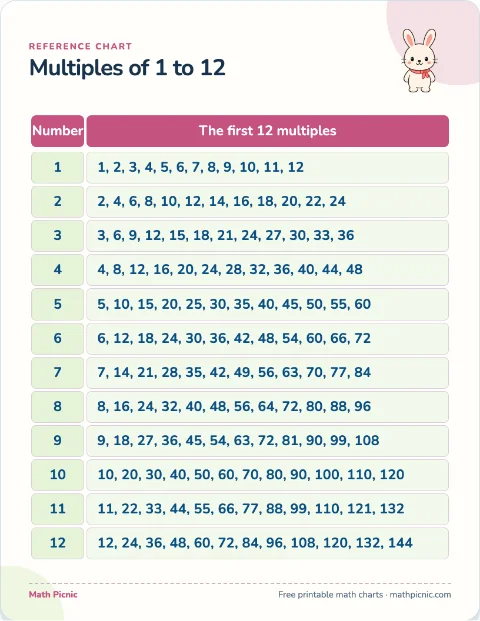 Print Run a finger along two rows until the same number appears in both.
 - Factors chart
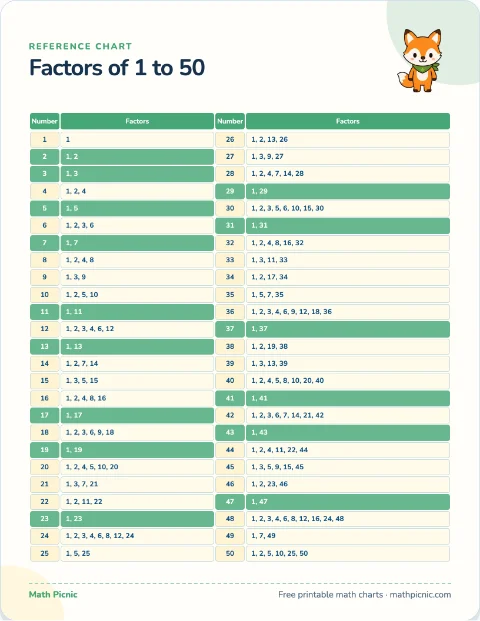 Print Read off every factor of a number before simplifying or finding a common one.