
Multiplication table 1–12
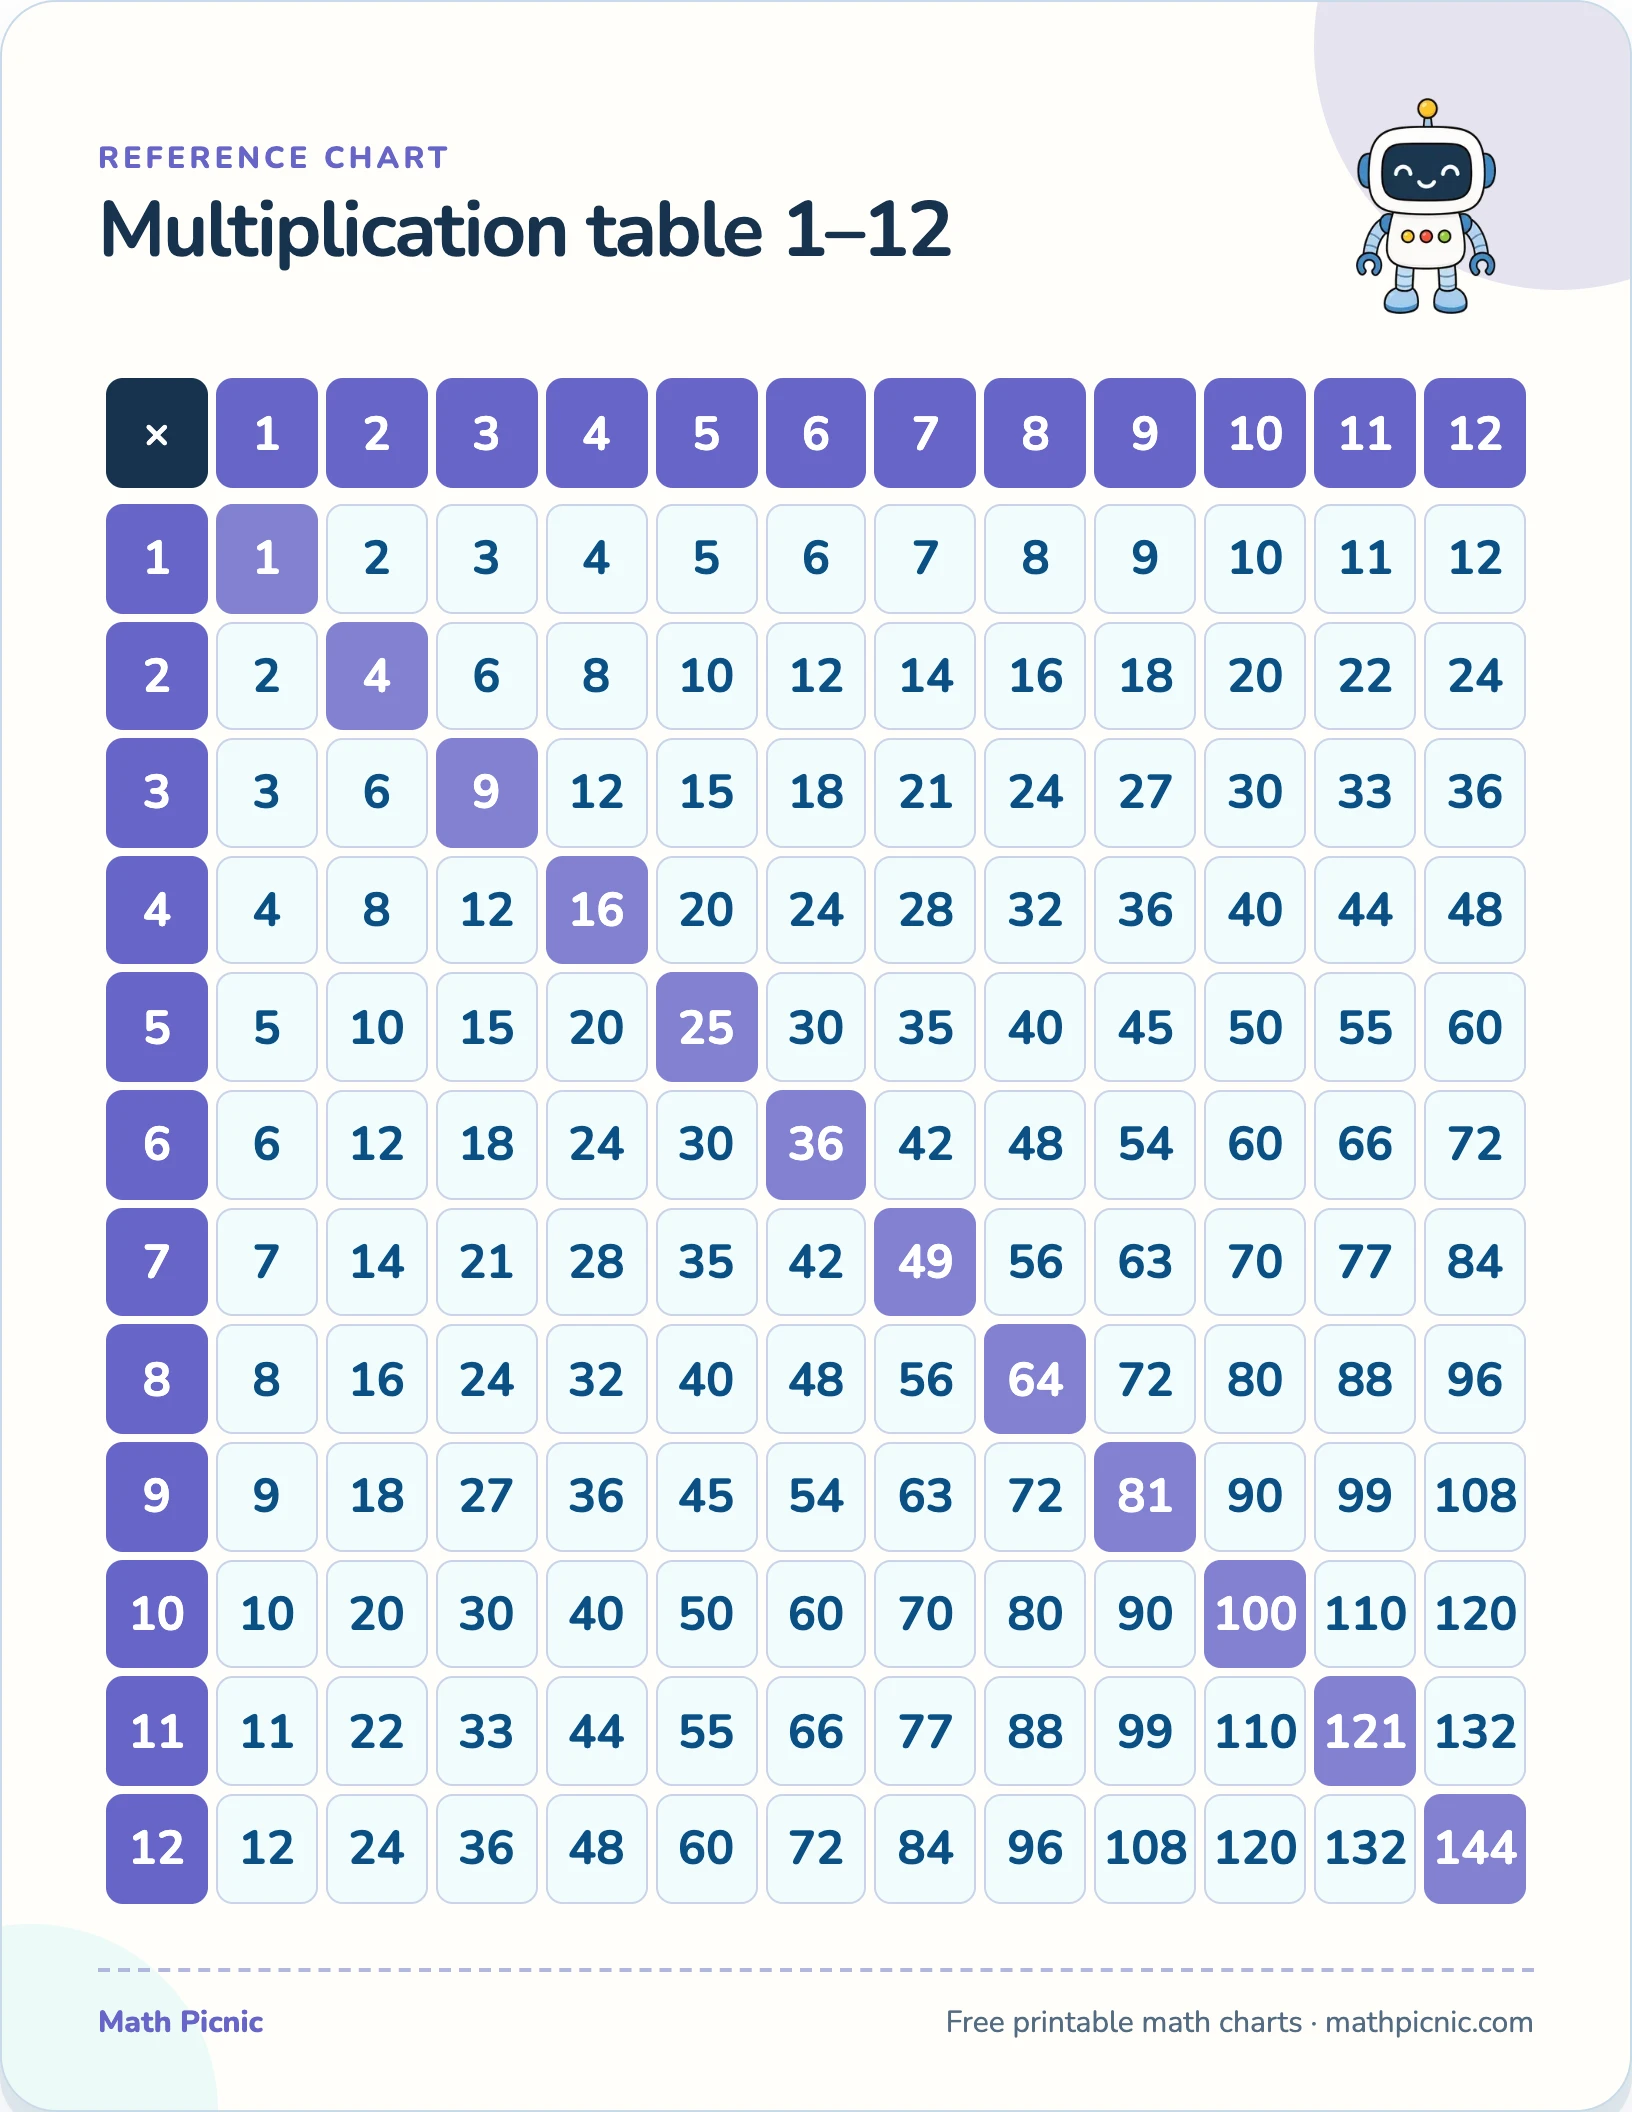
The whole times table on one page, from 1×1 to 12×12 — a multiplication chart for the wall beside the desk, or folded into a homework folder so a fact is always one glance away.
Reference chart
Multiplication table 1–12

| × | 1 | 2 | 3 | 4 | 5 | 6 | 7 | 8 | 9 | 10 | 11 | 12 |
|---|---|---|---|---|---|---|---|---|---|---|---|---|
| 1 | 1 | 2 | 3 | 4 | 5 | 6 | 7 | 8 | 9 | 10 | 11 | 12 |
| 2 | 2 | 4 | 6 | 8 | 10 | 12 | 14 | 16 | 18 | 20 | 22 | 24 |
| 3 | 3 | 6 | 9 | 12 | 15 | 18 | 21 | 24 | 27 | 30 | 33 | 36 |
| 4 | 4 | 8 | 12 | 16 | 20 | 24 | 28 | 32 | 36 | 40 | 44 | 48 |
| 5 | 5 | 10 | 15 | 20 | 25 | 30 | 35 | 40 | 45 | 50 | 55 | 60 |
| 6 | 6 | 12 | 18 | 24 | 30 | 36 | 42 | 48 | 54 | 60 | 66 | 72 |
| 7 | 7 | 14 | 21 | 28 | 35 | 42 | 49 | 56 | 63 | 70 | 77 | 84 |
| 8 | 8 | 16 | 24 | 32 | 40 | 48 | 56 | 64 | 72 | 80 | 88 | 96 |
| 9 | 9 | 18 | 27 | 36 | 45 | 54 | 63 | 72 | 81 | 90 | 99 | 108 |
| 10 | 10 | 20 | 30 | 40 | 50 | 60 | 70 | 80 | 90 | 100 | 110 | 120 |
| 11 | 11 | 22 | 33 | 44 | 55 | 66 | 77 | 88 | 99 | 110 | 121 | 132 |
| 12 | 12 | 24 | 36 | 48 | 60 | 72 | 84 | 96 | 108 | 120 | 132 | 144 |
What's on this chart
A times table chart is a map before it is a memory aid. Reading across a row and down a column to the square where they meet shows a child what multiplication actually is — rows of equal groups — long before the facts are automatic. The shaded diagonal marks the square numbers, 1×1 through 12×12, which is the line children tend to learn first and the easiest landmark for finding their place on a busy grid.
Why this chart helps
The chart goes to twelve rather than ten on purpose. Ten is where most classroom tables stop, but twelves keep turning up in real life — a dozen eggs, months in a year, inches in a foot — and a child who has seen the extra two columns is not startled by them later.
More printable charts
- Hundreds chart
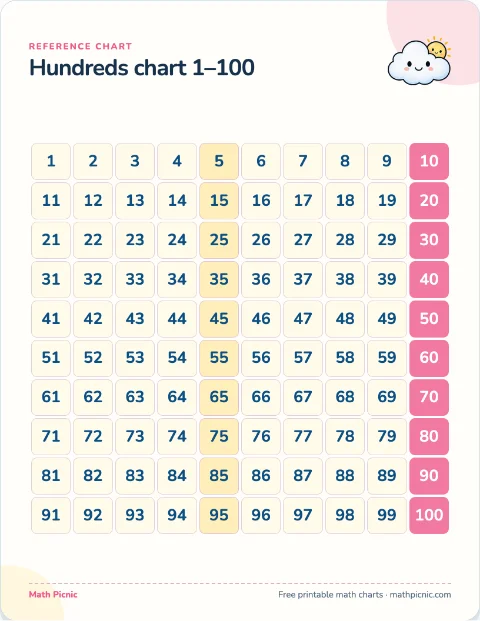 Print Count, skip count, or add ten by moving one square straight down.
 - Addition table
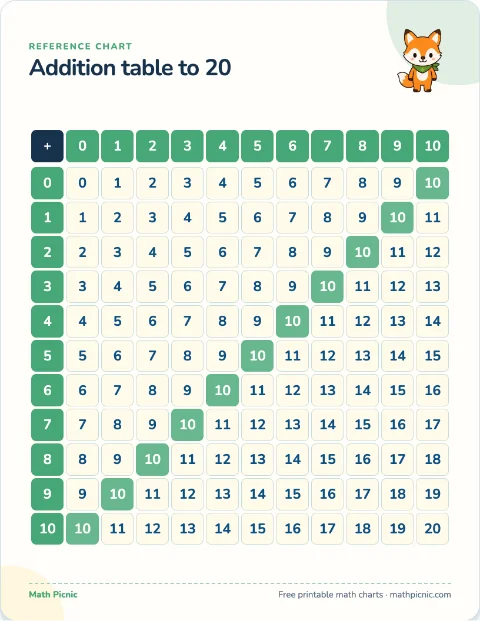 Print Follow a row and a column to the square where the two numbers meet.
 - Subtraction table
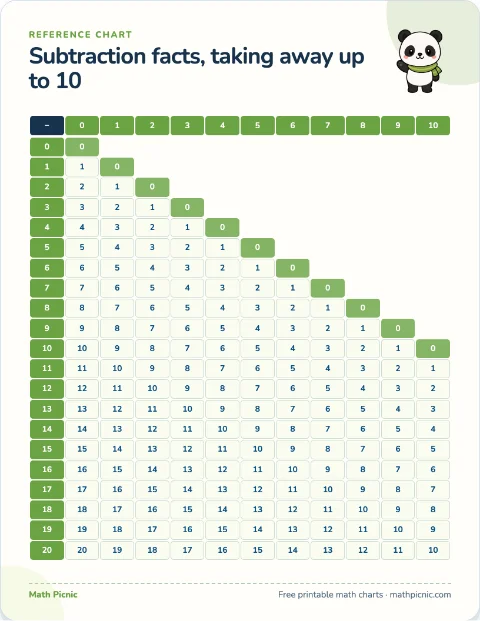 Print Start on the number being taken from, then read across to what is taken away.
 - Subtraction table to 20
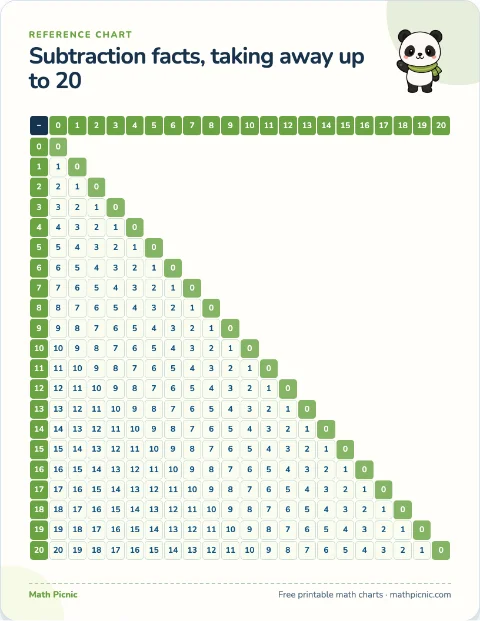 Print Find the top number down the side, the number taken away across the top.
 - Division table
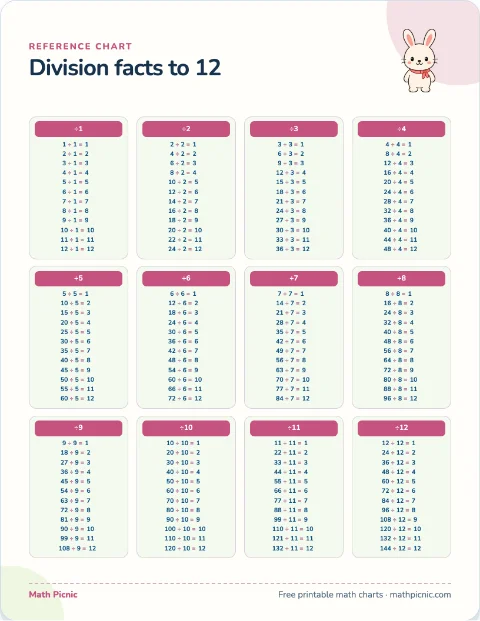 Print Find the family being divided by, then read down it to the answer.
 - Roman numerals
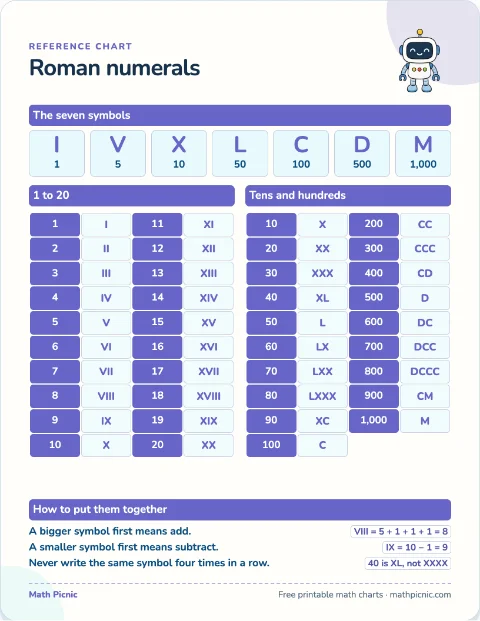 Print Build or read a numeral using the seven symbols and the three rules.
 - Multiples chart
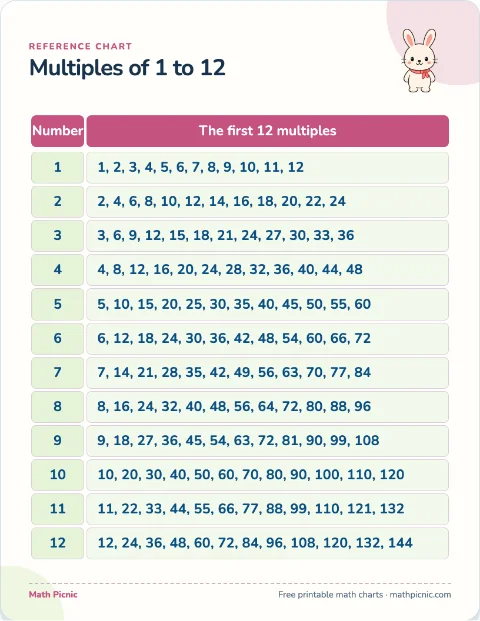 Print Run a finger along two rows until the same number appears in both.
 - Factors chart
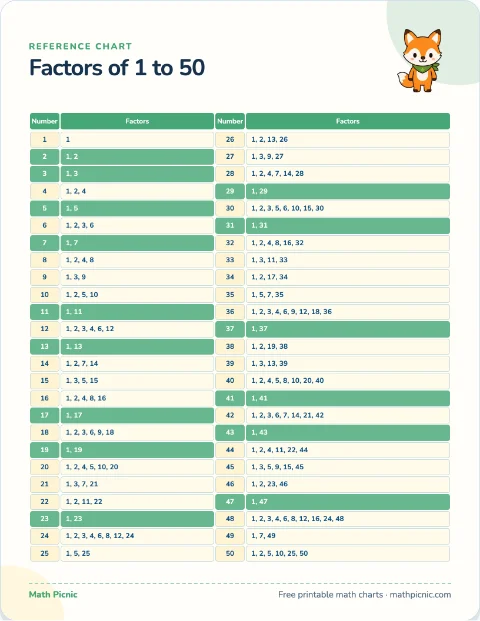 Print Read off every factor of a number before simplifying or finding a common one.