
Slope and y-intercept
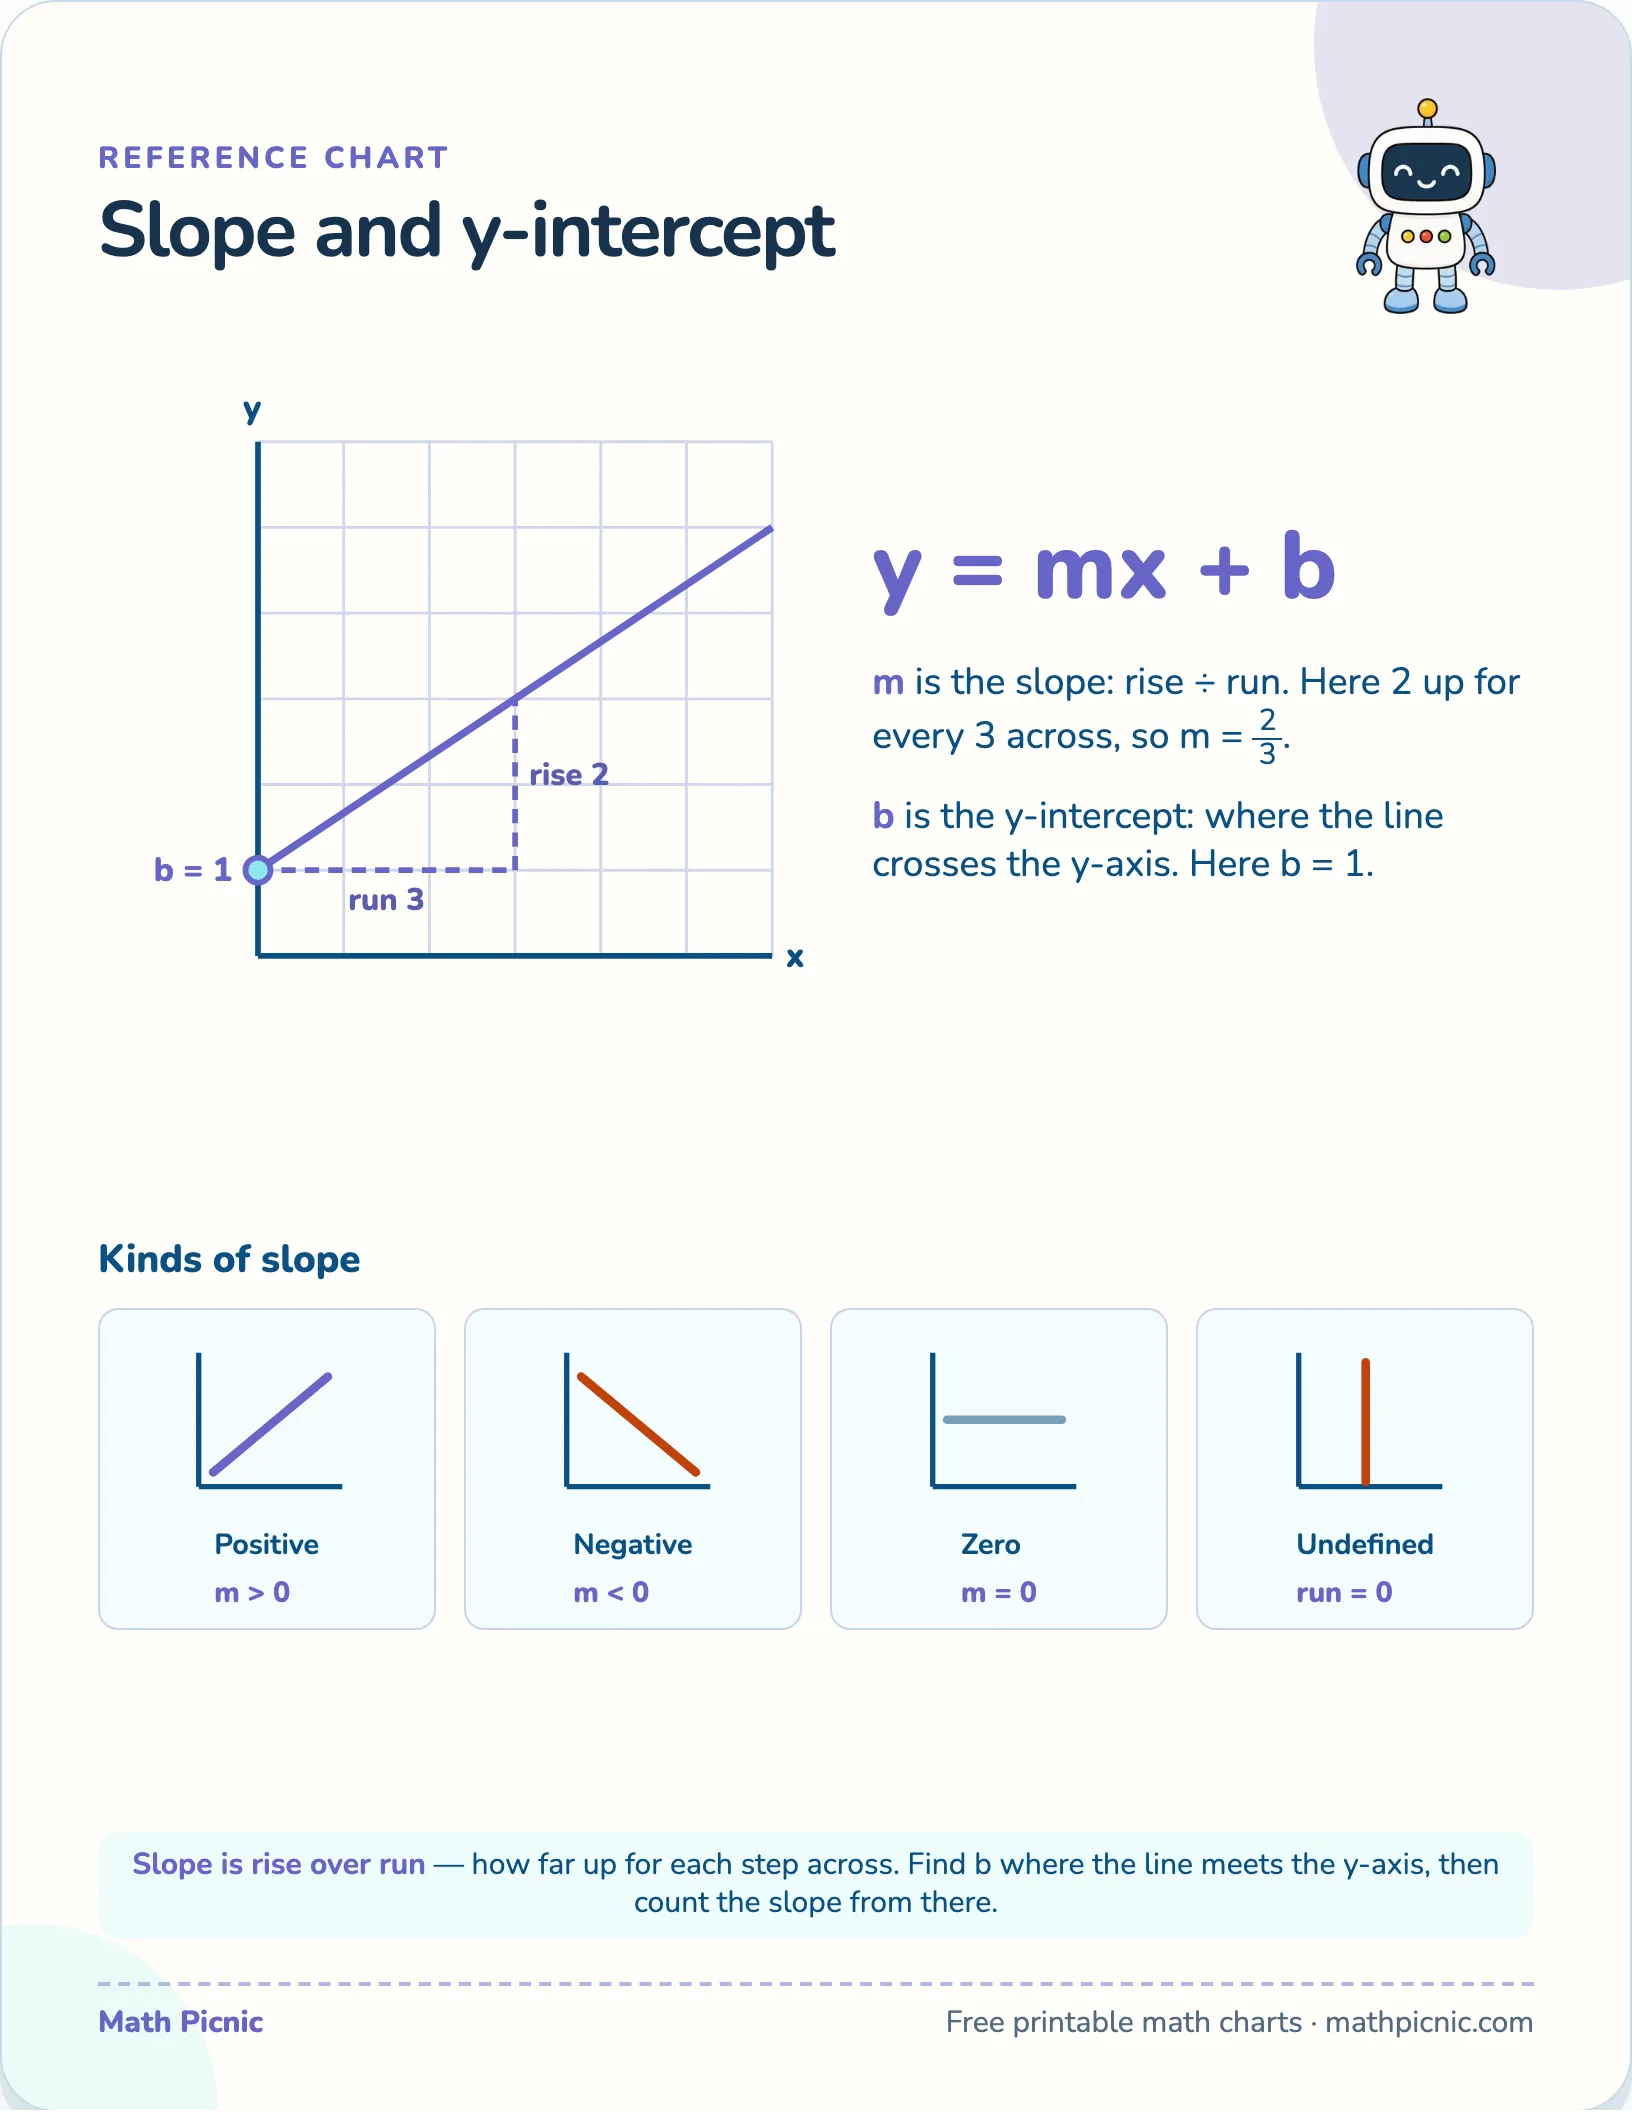
Slope is one idea — how steep a line is — and it is a ratio you can count off the grid: how far the line rises for each step it runs across. Read where the line crosses the y-axis and you have b; count rise over run and you have m; together they are y = mx + b.
Reference chart
Slope and y-intercept

y = mx + b
m is the slope: rise ÷ run. Here 2 up for every 3 across, so m = 23.
b is the y-intercept: where the line crosses the y-axis. Here b = 1.
Kinds of slope
Slope is rise over run — how far up for each step across. Find b where the line meets the y-axis, then count the slope from there.
What's on this chart
The line does the explaining. Start where it crosses the y-axis — that height is b, the y-intercept, here 1. From there, step across and up to any other point on the line: 3 across and 2 up. The slope m is that climb written as a ratio, rise over run, so m = 2/3. Every straight line has one steepness, which is why the same triangle drawn anywhere along it gives the same answer.
Why this chart helps
Put the two together and y = mx + b draws the whole line: start at b on the y-axis, then use m to step to the next point and the next. A child who can find b by eye and count the rise-over-run triangle can graph a line without plotting a table of values first — which is the shortcut the equation exists to give.
More printable charts
- Counting to 10
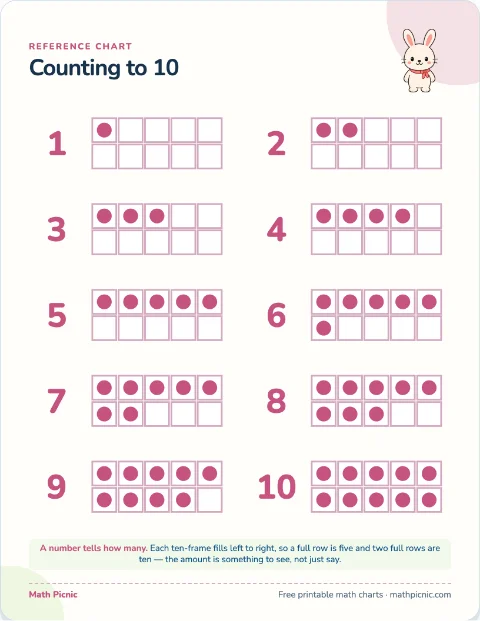 Print Count the dots in each ten-frame and read the number beside it.
 - Number bonds to 10
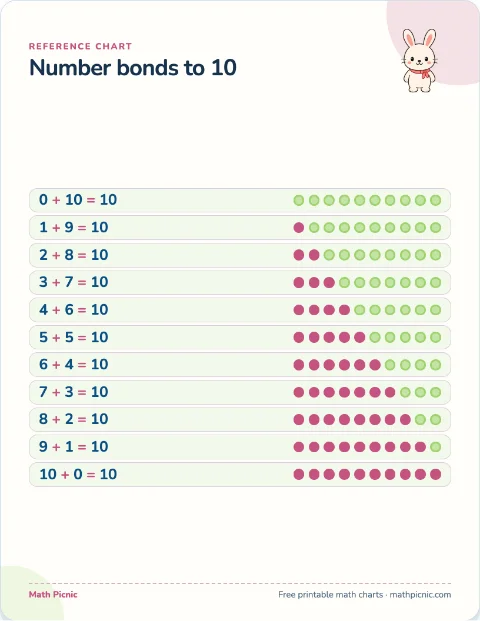 Print Read each row of counters and say the two numbers that make ten.
 - Comparing numbers
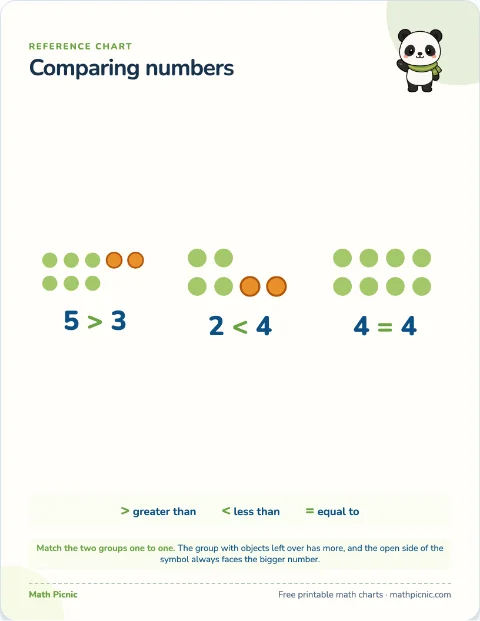 Print Line the two groups up one to one; the group with a leftover has more.
 - Odd and even
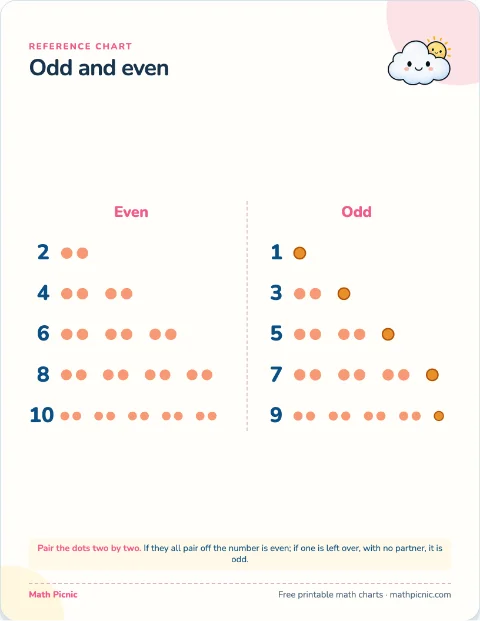 Print Pair the dots two by two; all paired is even, one left over is odd.
 - Number line 0–20
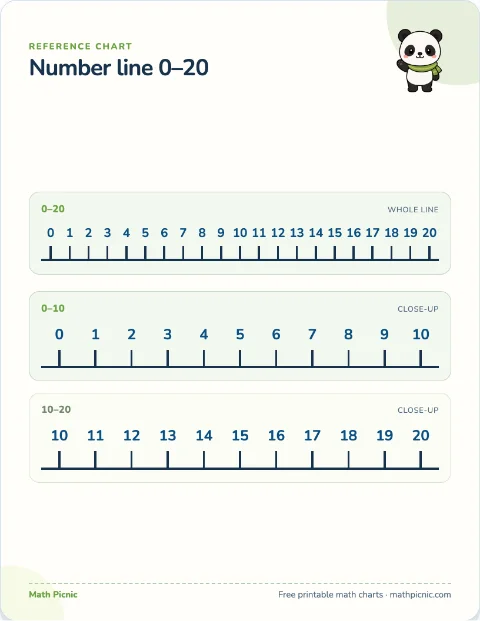 Print Count on or back by hopping along the line one number at a time.
 - Blank number line 0–20
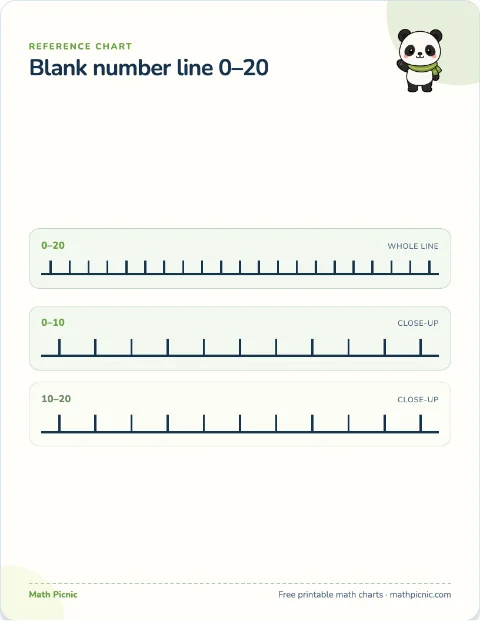 Print Label the ticks, mark a number, or draw equal jumps for an operation.
 - Number bonds to 20
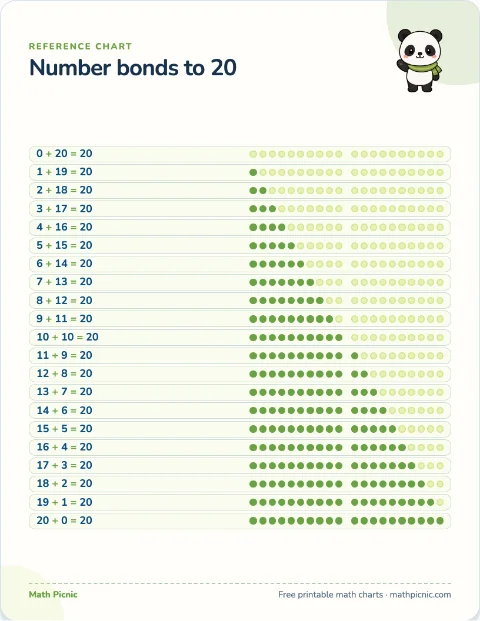 Print Count the two colors in a row and say the pair that makes twenty.
 - Telling the time
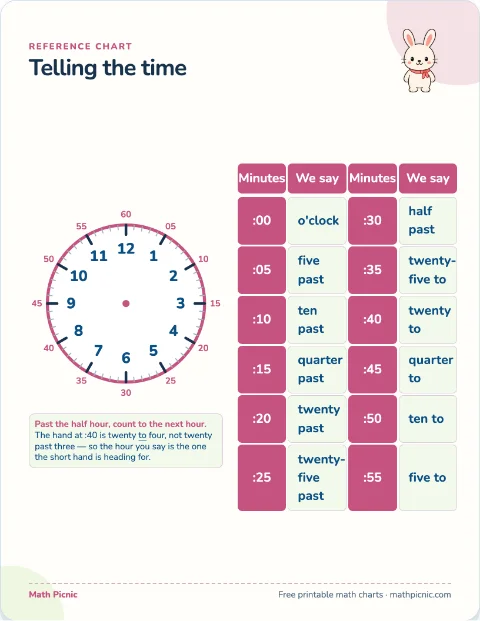 Print Read the hour inside the dial and the minutes printed outside it.